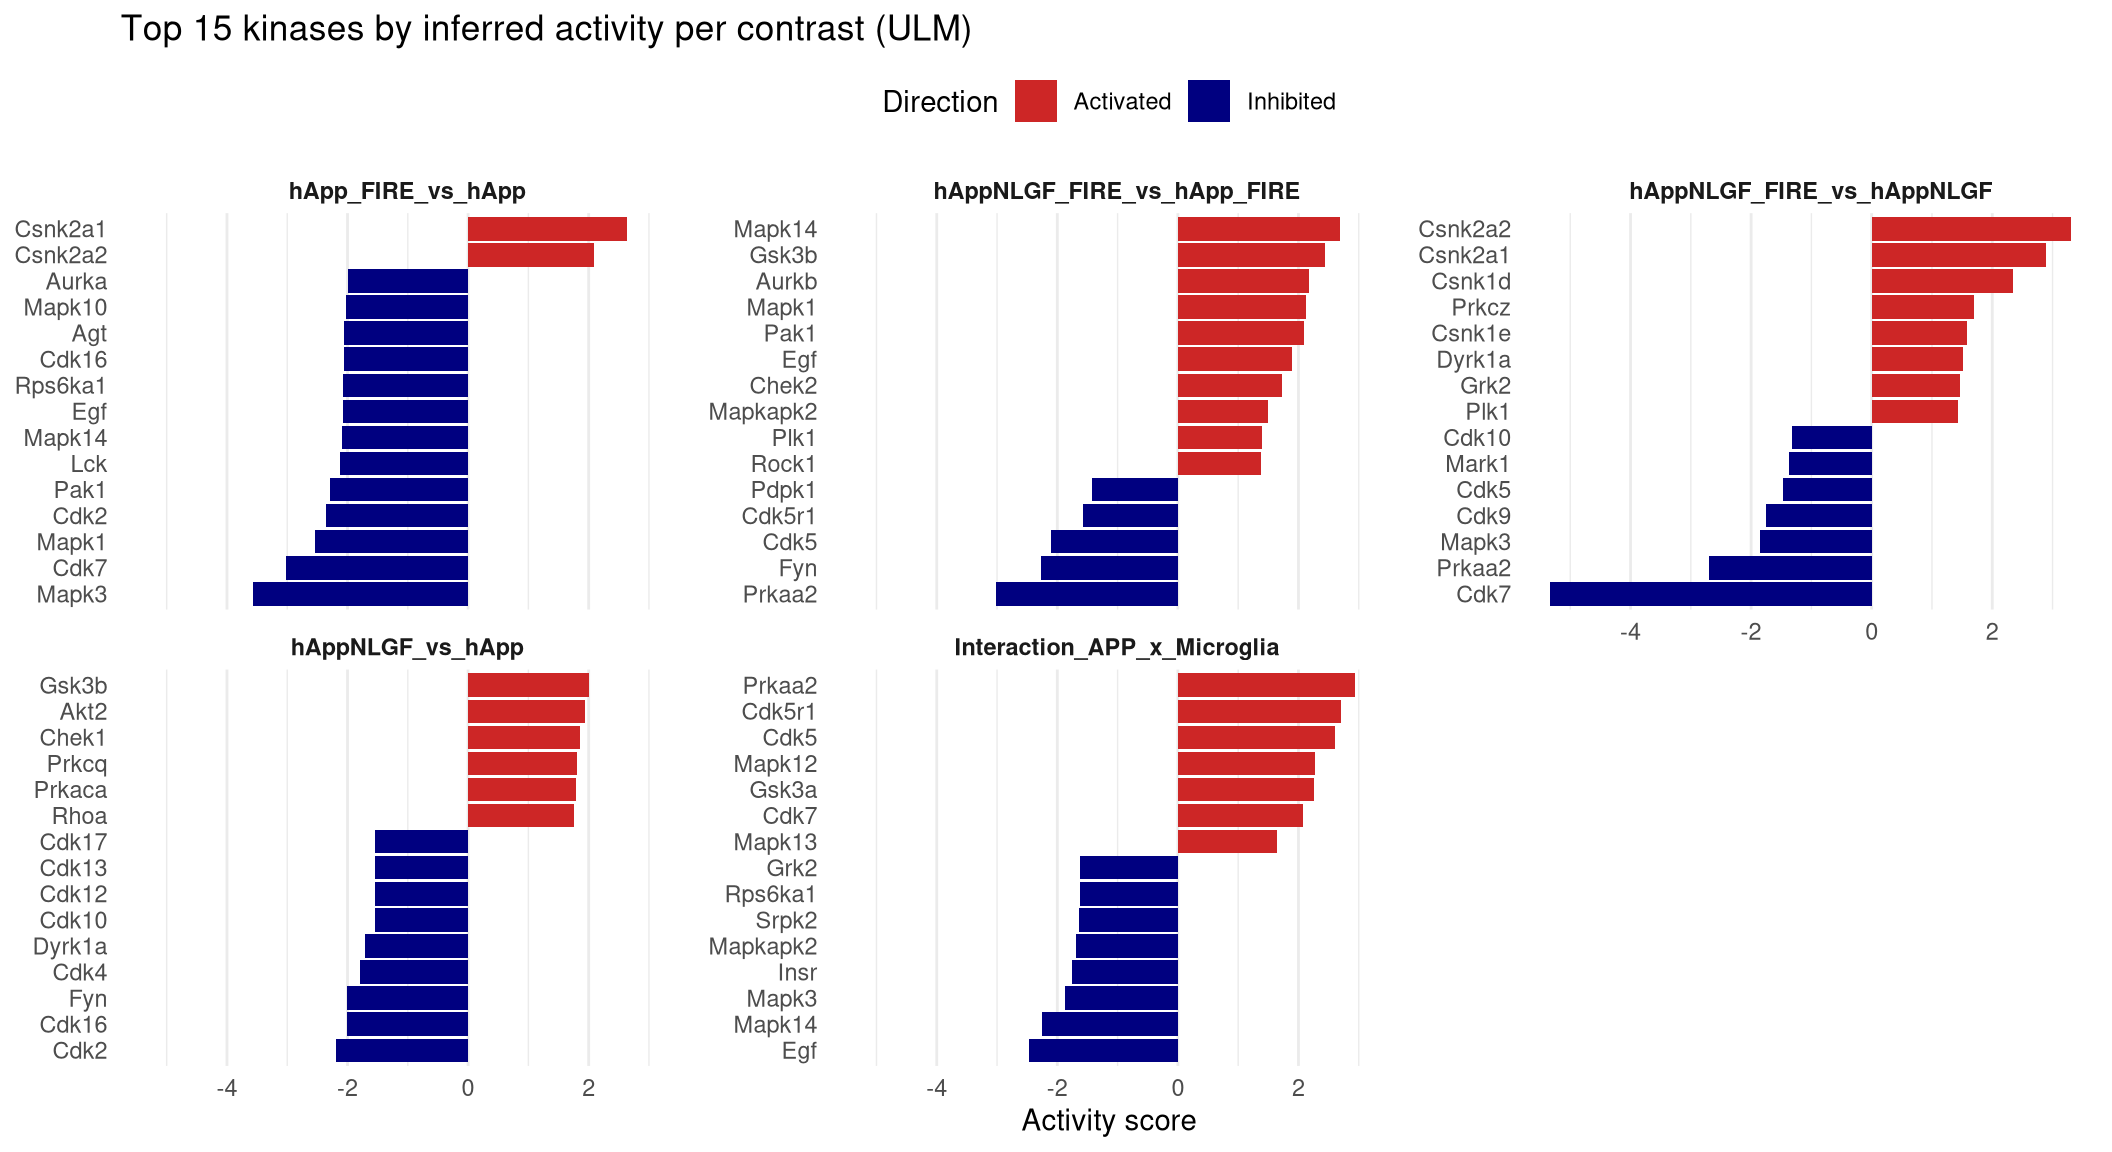
--- title: "4. Kinase activity inference" --- ## Overview `X` of protein `Y` went up" into "kinase `K` is more active." Uses `decoupleR` with the OmniPath kinase–substrate network (mouse). Two methods are run for robustness:- **WMEAN** — weighted mean of substrate t-statistics (fast, robust to network noise)- **ULM** — univariate linear model per kinase (calibrated p-values)## Setup notes - The OmniPath query needs internet on first run; results can be cached and reloaded.## Libraries ```{r setup, include=FALSE, message=FALSE} library(data.table) library(qs2) library(dplyr) library(tidyr) library(stringr) library(ggplot2) library(decoupleR) library(OmnipathR) library(AnnotationDbi) library(org.Mm.eg.db) library(tidytext) library(DT) library(htmltools) ``` ## Directories ```{r} <- "/nemo/lab/destrooperb/home/shared/zanettc/giulia_proteomics/phosphoproteomics" <- "run3" <- file.path (base_dir, "results" , run_num)<- file.path (base_dir, "data" , "processed" , run_num)<- file.path (results_dir, "Kinase_activity" )dir.create (kinase_dir, recursive = TRUE , showWarnings = FALSE )``` ## Load adjusted phospho results ```{r load} res_df <- fread(file.path(results_dir, "PTM_adjusted_GroupComparison.csv")) # Parse site identifier into accession + position(s) (same logic as notebook 03) res_df[, Accession := str_extract(Protein, "^[^_;]+")] res_df[, Sites_in_id := str_extract(Protein, "(?<=_)[STY][0-9]+(?:_[STY][0-9]+)*")] res_df[, Gene := mapIds(org.Mm.eg.db, keys = Accession, column = "SYMBOL", keytype = "UNIPROT", multiVals = "first")] res_df[, Gene := ifelse(is.na(Gene) | Gene == "", Accession, Gene)] # decoupleR needs site IDs of form Gene_S123. Expand multi-site rows. sites_long <- res_df[!is.na(Sites_in_id), .(Site = unlist(strsplit(Sites_in_id, "_"))), by = .(Label, Gene, log2FC, pvalue, adj.pvalue, Tvalue) ][, ID := paste0(Gene, "_", Site)] sites_long <- sites_long[!is.na(Gene)] cat("Site rows after expansion:", nrow(sites_long), "\n") ``` ## Pull mouse kinase–substrate network from OmniPath ```{r omnipath, message=FALSE} ks_net <- OmnipathR::enzyme_substrate( organism = 10090 ) %>% filter(modification == "phosphorylation") %>% mutate( target = paste0(substrate_genesymbol, "_", residue_type, residue_offset), source = enzyme_genesymbol, mor = 1 # all phospho-events are activating substrate phosphorylation ) %>% dplyr::select(source, target, mor) %>% distinct() cat("Kinase–substrate edges:", nrow(ks_net), "\n") cat("Unique kinases: ", length(unique(ks_net$source)), "\n") qs_save(ks_net, file.path(objects_dir, "omnipath_kinase_substrate.qs2")) ``` ## Score per contrast `Tvalue` ) so direction and magnitude are encoded.```{r score, message=FALSE} mat <- sites_long %>% dplyr::filter(!is.na(Tvalue)) %>% # drop NA Tvalue rows — max() returns -Inf on all-NA groups group_by(ID, Label) %>% summarise(stat = max(Tvalue, na.rm = TRUE), .groups = "drop") %>% pivot_wider(id_cols = ID, names_from = Label, values_from = stat, values_fill = 0) %>% as.data.frame() rownames(mat) <- mat$ID mat$ID <- NULL mat <- as.matrix(mat) # Filter to sites in the OmniPath network — others contribute no signal anyway mat <- mat[rownames(mat) %in% ks_net$target, , drop = FALSE] mat <- mat[apply(mat, 1, function(x) all(is.finite(x))), , drop = FALSE] cat("Sites mapped to OmniPath network:", nrow(mat), "\n") set.seed(42) acts_wmean <- decoupleR::run_wmean(mat = mat, network = ks_net, .source = "source", .target = "target", .mor = "mor", times = 1000, minsize = 5) acts_ulm <- decoupleR::run_ulm(mat = mat, network = ks_net, .source = "source", .target = "target", .mor = "mor", minsize = 5) qs_save(list(wmean = acts_wmean, ulm = acts_ulm), file.path(objects_dir, "kinase_activities.qs2")) ``` ## Tidy + export per-contrast tables ```{r export} #Per contrast comparison tidy <- function(df, method_label) { df %>% dplyr::filter(statistic == method_label) %>% dplyr::group_by(condition) %>% # <-- add this dplyr::mutate(padj = p.adjust(p_value, method = "BH")) %>% dplyr::ungroup() %>% dplyr::rename(Kinase = source, Contrast = condition, Activity = score) %>% dplyr::select(Contrast, Kinase, Activity, p_value, padj) } wmean_tidy <- tidy(acts_wmean, "norm_wmean") ulm_tidy <- tidy(acts_ulm, "ulm") fwrite(wmean_tidy, file.path(kinase_dir, "Kinase_activity_wmean.csv")) fwrite(ulm_tidy, file.path(kinase_dir, "Kinase_activity_ulm.csv")) sig_kinases <- ulm_tidy %>% dplyr::filter(padj < 0.05) %>% dplyr::arrange(Contrast, padj) #Prints padj values in brackets sig_kinases %>% dplyr::arrange(Contrast, padj) %>% dplyr::group_by(Contrast) %>% dplyr::summarise( n = dplyr::n(), kinases = paste0(Kinase, " (", signif(padj, 2), ")", collapse = ", "), .groups = "drop" ) %>% print() ``` ## Top kinase barplots per contrast (ULM) ```{r barplots, fig.width=11, fig.height=6} top_kinases <- ulm_tidy %>% group_by(Contrast) %>% arrange(desc(abs(Activity))) %>% slice_head(n = 15) %>% ungroup() %>% mutate(Direction = ifelse(Activity > 0, "Activated", "Inhibited")) p_kin <- ggplot(top_kinases, aes(x = reorder_within(Kinase, Activity, Contrast), y = Activity, fill = Direction)) + geom_col() + scale_x_reordered() + scale_fill_manual(values = c("Activated" = "firebrick3", "Inhibited" = "navy")) + facet_wrap(~ Contrast, ncol = 3, scales = "free_y") + coord_flip() + labs(title = "Top 15 kinases by inferred activity per contrast (ULM)", x = NULL, y = "Activity score") + theme_minimal(base_size = 11) + theme(legend.position = "top", strip.text = element_text(face = "bold"), panel.grid.major.y = element_blank()) print(p_kin) ggsave(file.path(kinase_dir, "Top15_kinases_per_contrast.pdf"), p_kin, width = 11, height = 6, device = cairo_pdf) ``` ## Substrates per contrast (p < 0.05) ```{r substrates, message=FALSE} contrasts_ordered <- sort(unique(as.data.table(sites_long)$Label)) kinase_stats <- as.data.table(ulm_tidy)[, .(Contrast, Kinase, KinaseActivity = Activity, KinasePvalue = p_value, KinasePadj = padj)] ks_dt <- as.data.table(ks_net)[, .(Kinase = source, ID = target)] build_section <- function(contrast) { substrates_dt <- as.data.table(sites_long)[ Label == contrast & pvalue < 0.05 ] body <- if (nrow(substrates_dt) == 0) { htmltools::p(htmltools::em("No substrates with p < 0.05.")) } else { joined <- merge(substrates_dt, ks_dt, by = "ID", allow.cartesian = TRUE) if (nrow(joined) == 0) { htmltools::p(htmltools::em( "No substrates with p < 0.05 mapped to OmniPath kinases.")) } else { joined <- merge(joined, kinase_stats[Contrast == contrast, .(Kinase, KinaseActivity, KinasePvalue, KinasePadj)], by = "Kinase", all.x = TRUE) tbl <- joined %>% as.data.frame() %>% dplyr::arrange(pvalue) %>% dplyr::mutate( log2FC = round(log2FC, 3), Tvalue = round(Tvalue, 3), pvalue = signif(pvalue, 3), adj.pvalue = signif(adj.pvalue, 3), KinaseActivity = round(KinaseActivity, 3), KinasePvalue = signif(KinasePvalue, 3), KinasePadj = signif(KinasePadj, 3) ) %>% dplyr::select( Kinase, `Kinase activity` = KinaseActivity, `Kinase p-value` = KinasePvalue, `Kinase padj` = KinasePadj, `Substrate site` = ID, Gene, Site, log2FC, `T-value` = Tvalue, `p-value` = pvalue, `adj. p-value` = adj.pvalue ) DT::datatable( tbl, rownames = FALSE, filter = "top", options = list(pageLength = 10, scrollX = TRUE) ) } } htmltools::tagList(htmltools::h3(contrast), body) } htmltools::tagList(lapply(contrasts_ordered, build_section)) ```