QC for the phosphoproteome MSstats report from Spectronaut. Mirrors the bulk-proteome QC (notebook 01_initial_qc_spectronaut.qmd in bulk_proteomics/) but operates on phosphopeptide-level data and tracks phosphosite-level metrics.
Important note on this Spectronaut export: the file does not include EG.PTMLocalizationProbabilities (or EG.PTMAssayProbability). All phospho-site information lives in EG.ModifiedSequence (e.g. _AAS[Phospho (STY)]TPGK_). MSstatsPTM downstream needs a mouse FASTA to map sequence positions to protein residues — see notebook 02. For QC here we count phosphosites by parsing EG.ModifiedSequence directly.
meta <-data.table(FileName =paste0("GA_", 1:16),Condition =rep(c("hApp", "hAppNLGF", "hAppNLGF_FIRE", "hApp_FIRE"), each =4),BioReplicate =rep(1:4, times =4),Has_Microglia =rep(c(TRUE, TRUE, FALSE, FALSE), each =4))meta
Load the phospho report
Read only the columns needed for QC and phosphosite parsing.
A “phosphosite” here is a (protein, peptide, S/T/Y position-within-peptide) tuple — the peptide-relative position. Absolute protein-residue numbering requires the FASTA mapping, done in notebook 02.
Code
# Helper: extract phospho positions within the modified sequence (Vectorized)extract_phospho_positions_vec <-function(modseq) {# 1. Remove leading/trailing underscores m <-str_replace_all(modseq, "_", "")# 2. Strip non-phospho mods entirely. # Use ifelse() so it handles vectors of length > 1 correctly m_clean <-str_replace_all(m, "\\[[^\\]]*\\]", function(x) {ifelse(str_detect(x, "Phospho"), x, "") })# 3. Split the sequence on the exact Phospho tags parts <-str_split(m_clean, "\\[Phospho \\(STY\\)\\]")# 4. Count the residues and calculate positionsvapply(parts, function(p) {# If the length is 1, it means no split occurred (no phospho present or NA)if (length(p) ==1) return(NA_character_) # Each part before the last contains only residue chars residue_counts <-nchar(p[-length(p)]) positions <-cumsum(residue_counts)# Return as a semicolon-separated string (e.g., "3;5")paste(positions, collapse =";") }, FUN.VALUE =character(1)) }cat("Parsing phosphosite positions (vectorized)...\n")
Parsing phosphosite positions (vectorized)...
Code
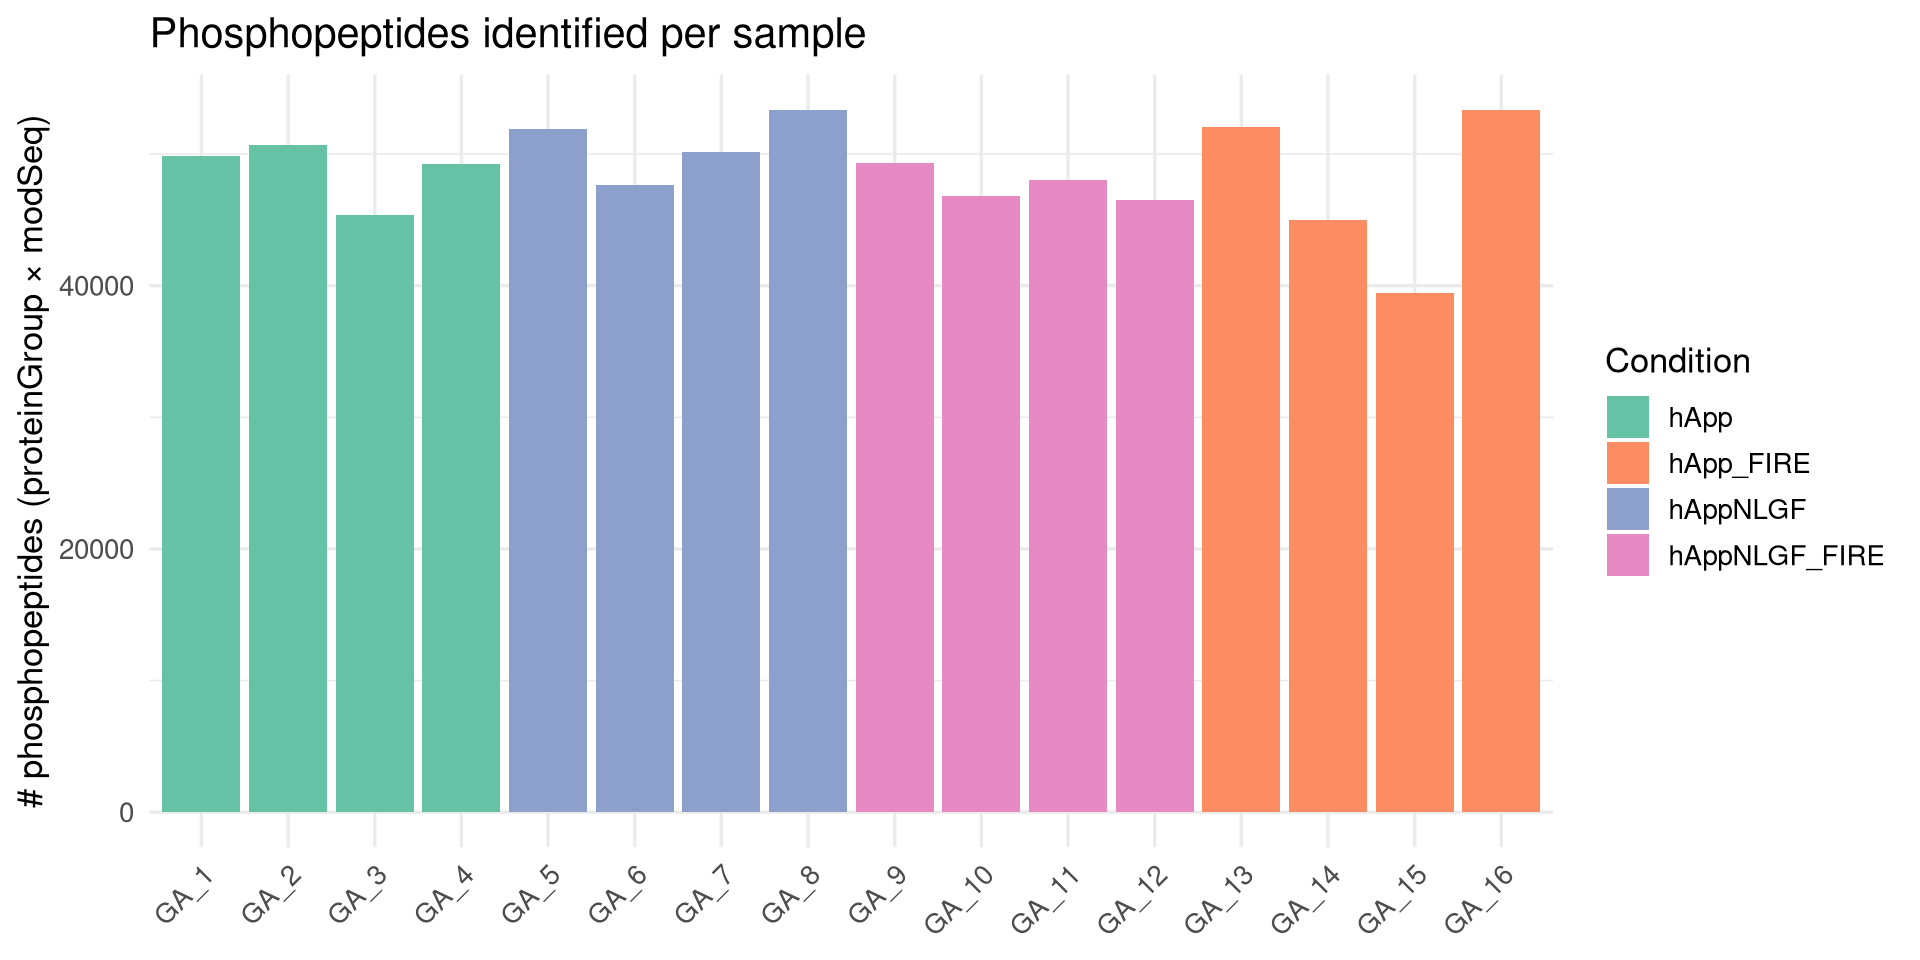
# Vectorized call — completely replaces mapply + unlistphospho_raw[, PhosphoPos :=extract_phospho_positions_vec(EG.ModifiedSequence)]# Per-sample summary -> need to use correct filenamesphospho_raw[, R.FileName :=str_replace(R.FileName, "^GA_P_", "GA_")]# Then re-run sample_summary as beforesample_summary <- phospho_raw[ , .(n_features =uniqueN(EG.PrecursorId),n_modseq =uniqueN(EG.ModifiedSequence),n_phosphopeptides =uniqueN(paste(PG.ProteinGroups, EG.ModifiedSequence)),n_phosphoproteins =uniqueN(PG.ProteinGroups) ), by = R.FileName]sample_summary <- sample_summary[meta, on =c(R.FileName ="FileName")]sample_summary <- sample_summary[meta, on =c(R.FileName ="FileName")]print(sample_summary[order(R.FileName)])
Empty data.table (0 rows and 3 cols): R.FileName,Condition,n_phosphopeptides
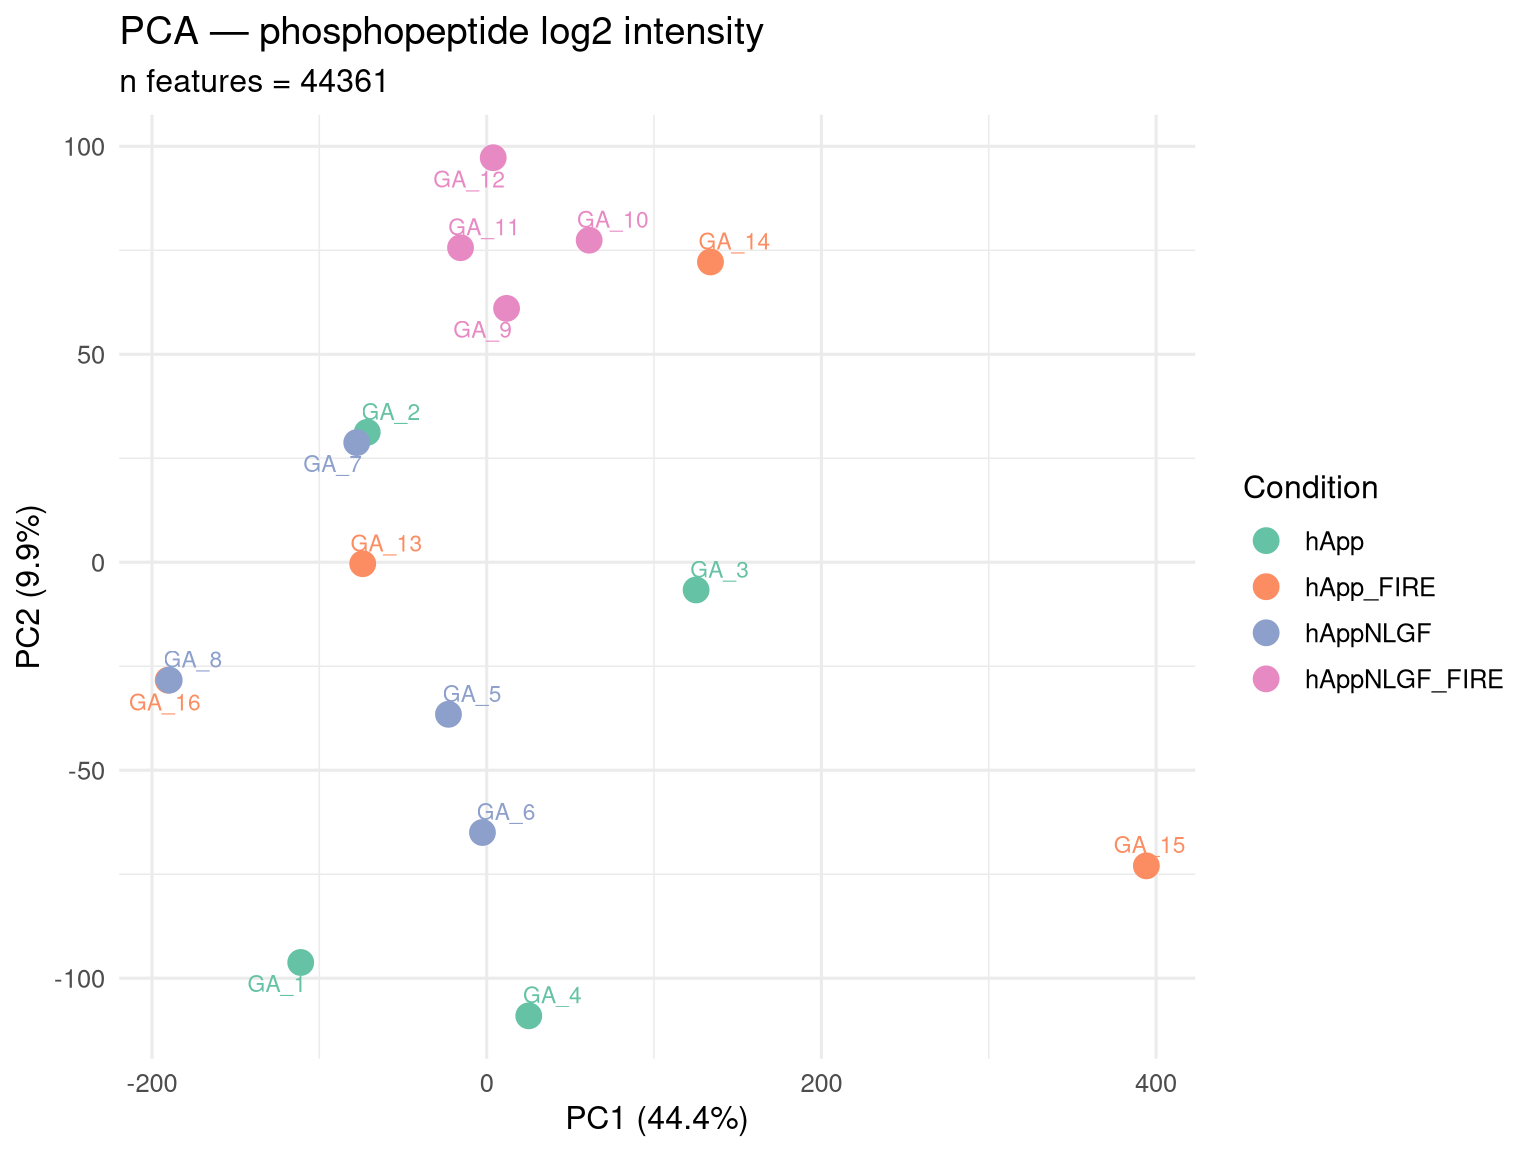
PCA on phosphopeptide intensities
Aggregate to one log2 intensity per (modSeq × sample), wide format, log2-transform, replace NAs with column-wise medians for PCA only (this is QC, not stats).
Code
# One value per (proteinGroup, modSeq, sample) — sum fragment areasphospho_intens <- phospho_raw[ , .(Intensity =sum(F.PeakArea, na.rm =TRUE)), by = .(PG.ProteinGroups, EG.ModifiedSequence, R.FileName)]# Drop near-zero intensitiesphospho_intens <- phospho_intens[Intensity >0]phospho_intens[, log2I :=log2(Intensity +1)]wide <-dcast(phospho_intens, PG.ProteinGroups + EG.ModifiedSequence ~ R.FileName,value.var ="log2I")mat <-as.matrix(wide[, -(1:2)])rownames(mat) <-paste(wide$PG.ProteinGroups, wide$EG.ModifiedSequence)# Keep features observed in >= 12 of 16 samples for PCA stabilitykeep <-rowSums(!is.na(mat)) >=12mat <- mat[keep, , drop =FALSE]# Median-impute NAs by column for PCA onlyfor (j inseq_len(ncol(mat))) { miss <-is.na(mat[, j])if (any(miss)) mat[miss, j] <-median(mat[, j], na.rm =TRUE)}pca <-prcomp(t(mat), scale. =TRUE)pca_df <-as.data.frame(pca$x[, 1:3])pca_df$Sample <-rownames(pca_df)pca_df$Condition <- meta$Condition[match(pca_df$Sample, meta$FileName)]ve <-summary(pca)$importance[2, ] *100p_pca <-ggplot(pca_df, aes(PC1, PC2, color = Condition, label = Sample)) +geom_point(size =4) + ggrepel::geom_text_repel(size =3, max.overlaps =50) +scale_color_brewer(palette ="Set2") +labs(title ="PCA — phosphopeptide log2 intensity",subtitle =paste0("n features = ", nrow(mat)),x =sprintf("PC1 (%.1f%%)", ve[1]),y =sprintf("PC2 (%.1f%%)", ve[2])) +theme_minimal(base_size =12)print(p_pca)