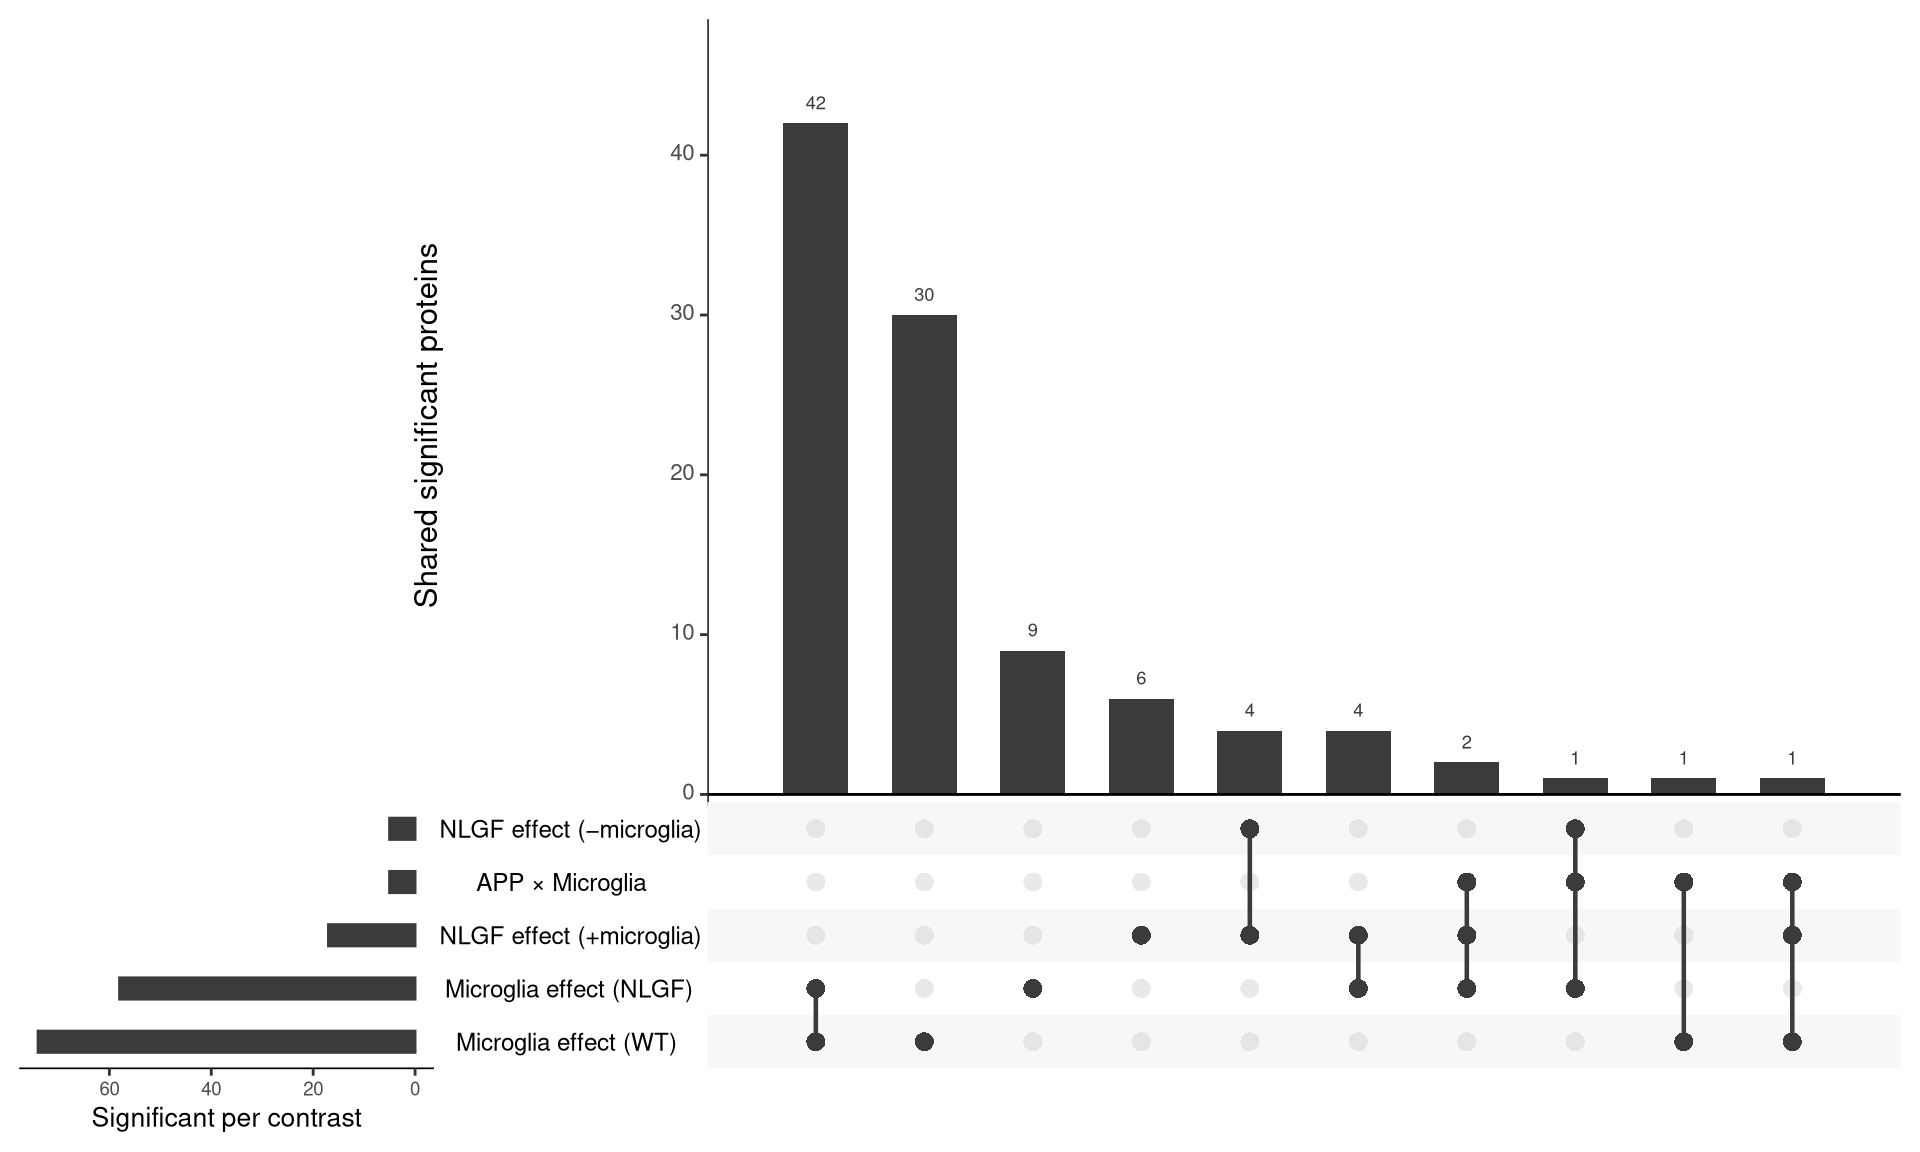
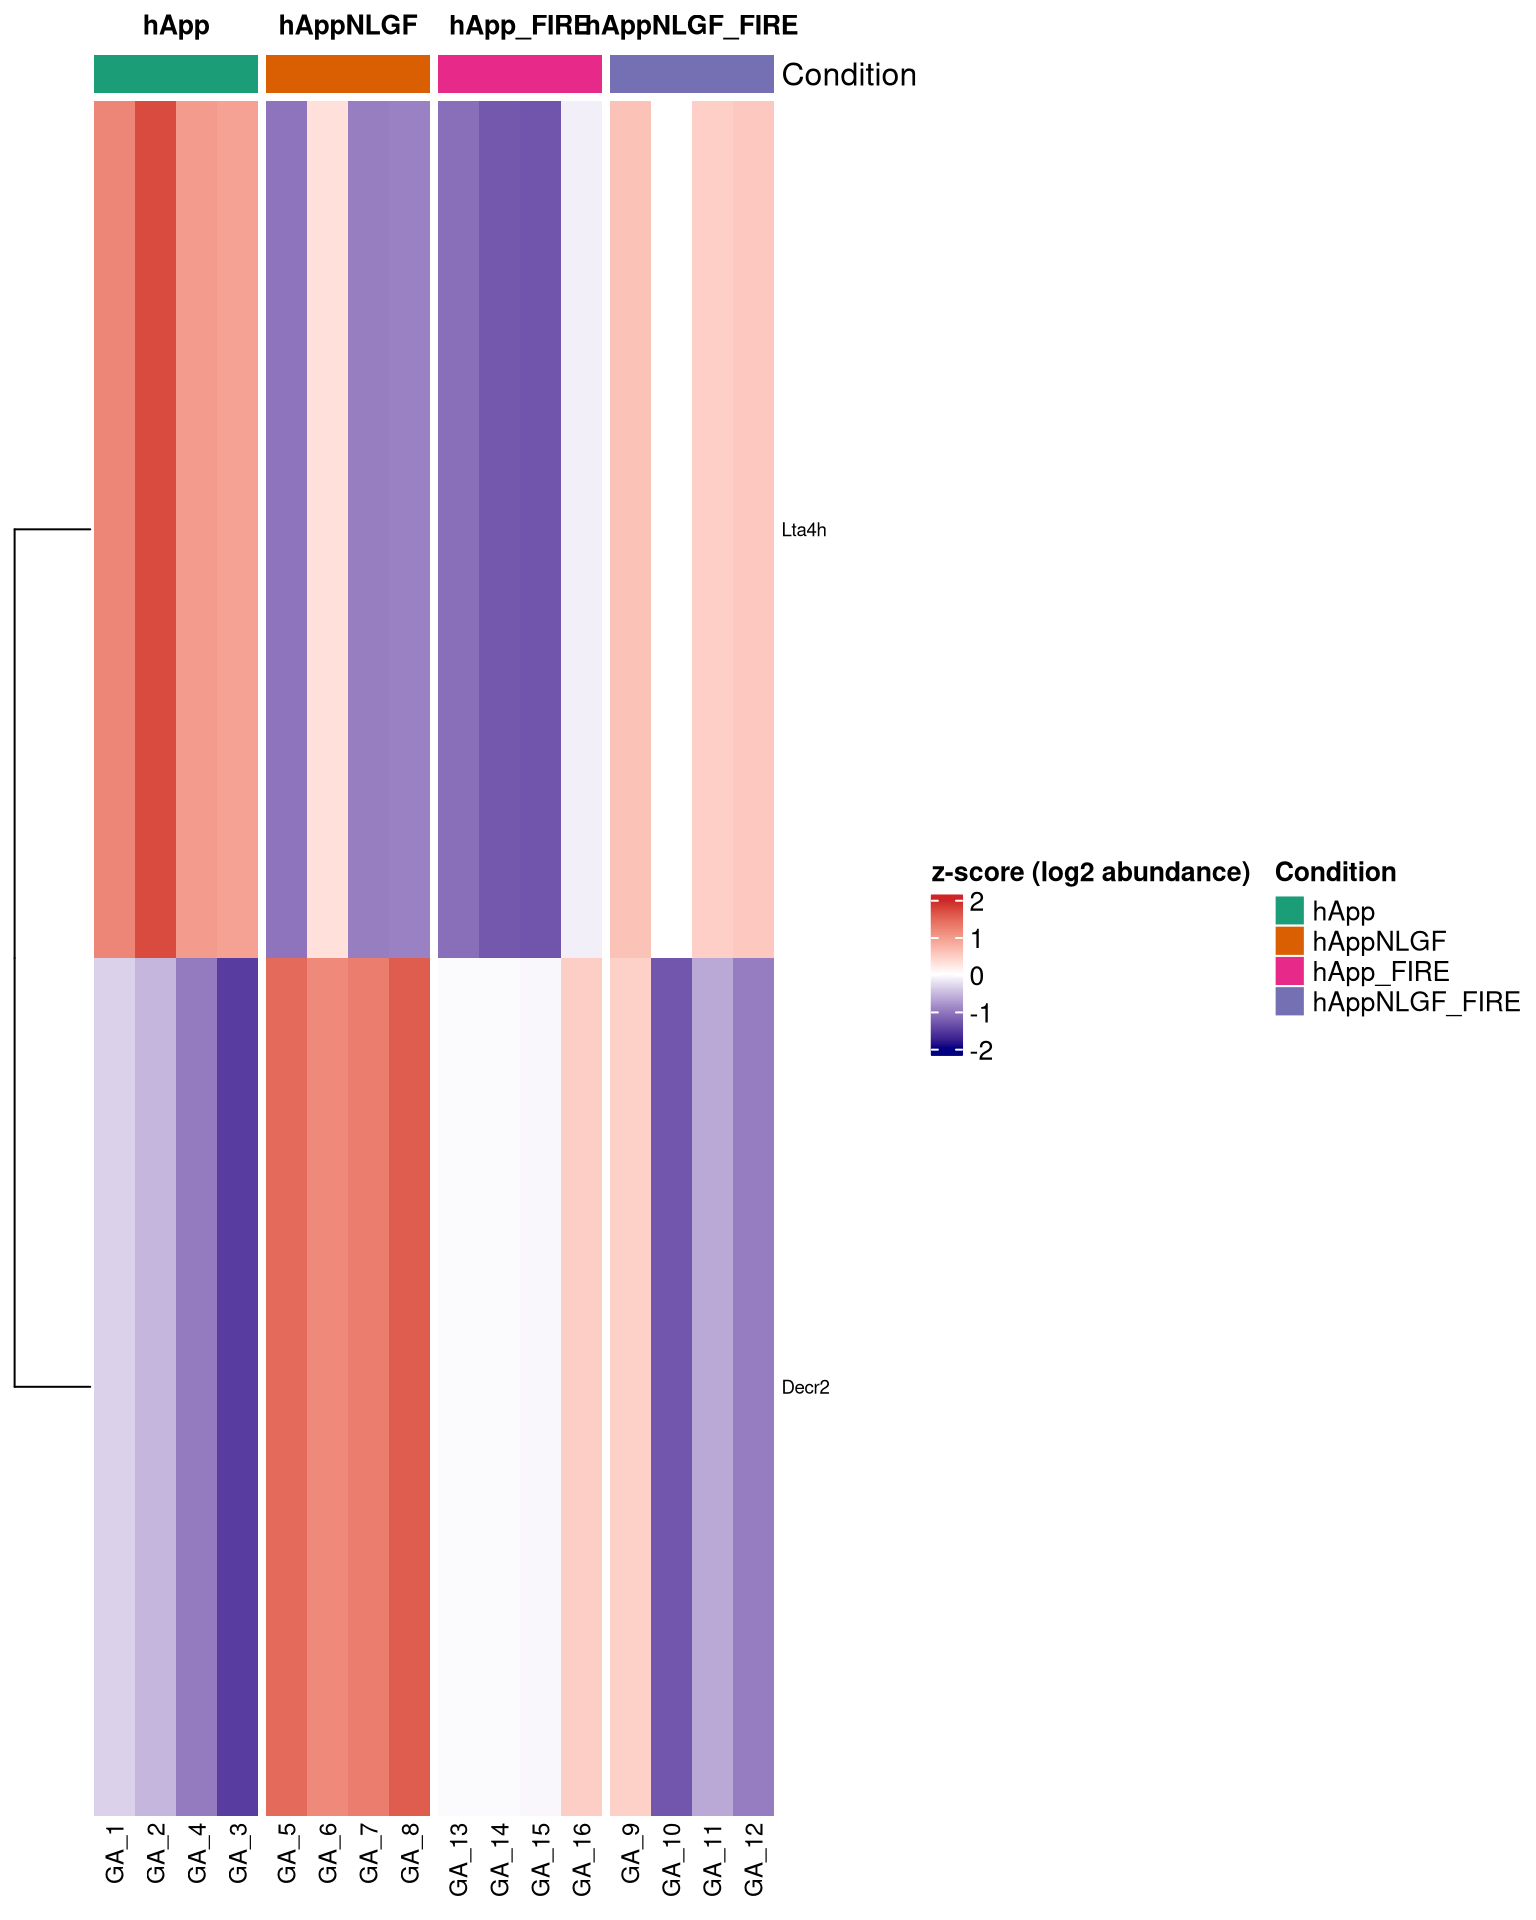
--- title: "5. Microglia-attributable proteins modulated by APP-NLGF" --- ## Overview 1. **Interaction-based** — proteins where the NLGF effect differs depending on microglia presence (interaction contrast, single statistical test).2. **Set-based** — overlap of significant proteins across the NLGF (hAppNLGF vs hApp) and microglia-depletion (hApp_FIRE vs hApp) contrasts, visualised as an UpSet plot.## Libraries ```{r setup, include=FALSE, message=FALSE} library(data.table) library(qs2) library(dplyr) library(tidyr) library(stringr) library(ggplot2) library(ggrepel) library(UpSetR) library(ComplexHeatmap) library(circlize) ``` ## Directories ```{r} <- "/nemo/lab/destrooperb/home/shared/zanettc/giulia_proteomics/bulk_proteomics" <- "run4" <- file.path (base_dir, "results" , run_num)<- file.path (base_dir, "data" , "processed" , run_num)<- file.path (results_dir, "Interaction_Microglia_APP" )dir.create (interaction_dir, recursive = TRUE , showWarnings = FALSE )# Significance thresholds (kept consistent with notebook 03) <- 0.05 <- 0.5 ``` ## Load DE results, processed abundance, and protein dictionary ```{r} <- fread (file.path (results_dir, "Full_GroupComparison_Results.csv" ))<- qs_read (file.path (objects_dir, "processed_msstats_data.qs2" ))<- fread (file.path (objects_dir, "protein_dictionary.csv" ))# Map gene names onto results <- res_df %>% filter (! is.na (adj.pvalue), is.finite (log2FC)) %>% left_join (protein_dictionary, by = "Protein" ) %>% mutate (Gene = ifelse (is.na (Gene) | Gene == "" , Protein, Gene))cat ("Contrasts present: \n " )print (unique (res_ann$ Label))``` ## Define protein sets ```{r} # Helper: significant proteins in a given contrast (returns Gene-level set) <- function (df, contrast, direction = c ("any" , "up" , "down" )) {<- match.arg (direction)<- df %>% filter (Label == contrast, adj.pvalue < FDR_CUT)<- switch (direction,any = d %>% filter (abs (log2FC) > LOGFC_CUT),up = d %>% filter (log2FC > LOGFC_CUT),down = d %>% filter (log2FC < - LOGFC_CUT))unique (d$ Gene)<- sig_genes (res_ann, "hAppNLGF_vs_hApp" ) # NLGF effect, microglia present <- sig_genes (res_ann, "hApp_FIRE_vs_hApp" ) # microglia depletion in hApp <- sig_genes (res_ann, "hAppNLGF_FIRE_vs_hAppNLGF" ) # microglia depletion in hAppNLGF <- sig_genes (res_ann, "hAppNLGF_FIRE_vs_hApp_FIRE" ) # NLGF effect, no microglia <- sig_genes (res_ann, "Interaction_APP_x_Microglia" )# Microglia-attributable: significantly *down* when microglia depleted in either APP background <- union (sig_genes (res_ann, "hApp_FIRE_vs_hApp" , direction = "down" ),sig_genes (res_ann, "hAppNLGF_FIRE_vs_hAppNLGF" , direction = "down" )cat ("Set sizes: \n " )print (c (NLGF_in_micro = length (set_NLGF_in_micro),FIRE_hApp = length (set_FIRE_hApp),FIRE_hAppNLGF = length (set_FIRE_hAppNLGF),NLGF_in_FIRE = length (set_NLGF_in_FIRE),Interaction = length (set_interaction),microglia_attributable = length (microglia_attributable)``` ## UpSet plot — overlap of significant proteins across key contrasts ```{r upset, fig.width=10, fig.height=6} upset_input <- list( "NLGF effect (+microglia)" = set_NLGF_in_micro, "NLGF effect (−microglia)" = set_NLGF_in_FIRE, "Microglia effect (WT)" = set_FIRE_hApp, "Microglia effect (NLGF)" = set_FIRE_hAppNLGF, "APP × Microglia" = set_interaction ) # UpSetR uses fromList() upset_obj <- upset( fromList(upset_input), order.by = "freq", nsets = length(upset_input), nintersects = 30, text.scale = c(1.4, 1.2, 1.2, 1.0, 1.3, 1.1), point.size = 3, line.size = 0.8, mainbar.y.label = "Shared significant proteins", sets.x.label = "Significant per contrast" ) print(upset_obj) pdf(file.path(interaction_dir, "UpSet_significant_proteins.pdf"), width = 10, height = 6) print(upset_obj) dev.off() ``` ## Microglia-attributable + APP-NLGF-modulated proteins ```{r} # Two operational definitions of "modulated by APP-NLGF": <- microglia_attributable %>% intersect (set_NLGF_in_micro)<- microglia_attributable %>% intersect (set_interaction)cat ("Microglia-attributable AND significant in (hAppNLGF vs hApp): " ,length (modulated_by_NLGF_pairwise), " \n " )cat ("Microglia-attributable AND significant in interaction contrast:" ,length (modulated_by_NLGF_interaction), " \n " )<- union (modulated_by_NLGF_pairwise, modulated_by_NLGF_interaction)cat ("Union (target heatmap set):" , length (target_genes), " \n " )# Export the table <- res_ann %>% filter (Gene %in% target_genes) %>% select (Gene, Protein, Description, Label, log2FC, adj.pvalue) %>% pivot_wider (id_cols = c (Gene, Protein, Description),names_from = Label,values_from = c (log2FC, adj.pvalue)%>% arrange (Gene)fwrite (target_table,file.path (interaction_dir, "Microglia_attributable_NLGF_modulated.csv" ))``` ## Heatmap of microglia-attributable, APP-NLGF-modulated proteins `ProteinLevelData` ). Z-scored per protein.```{r heatmap, fig.width=8, fig.height=10} abund <- as.data.table(processed_data$ProteinLevelData) # MSstats stores abundance under either 'LogIntensities' or 'ABUNDANCE' depending # on the package version — pick whichever exists. abund_col <- intersect(c("LogIntensities", "ABUNDANCE"), names(abund))[1] stopifnot(!is.na(abund_col)) abund_wide <- abund %>% as.data.frame() %>% select(Protein, RUN = originalRUN, GROUP, all_of(abund_col)) %>% rename(value = !!abund_col) %>% pivot_wider(id_cols = Protein, names_from = RUN, values_from = value) %>% left_join(protein_dictionary, by = "Protein") %>% mutate(Gene = ifelse(is.na(Gene) | Gene == "", Protein, Gene)) # Subset to target gene set; resolve duplicate Genes by taking the most-detected row mat_df <- abund_wide %>% filter(Gene %in% target_genes) %>% group_by(Gene) %>% slice_max(order_by = rowSums(!is.na(across(starts_with("GA_")))), n = 1, with_ties = FALSE) %>% ungroup() mat <- mat_df %>% select(starts_with("GA_")) %>% as.matrix() rownames(mat) <- mat_df$Gene # Z-score per protein mat_z <- t(scale(t(mat))) mat_z[!is.finite(mat_z)] <- NA # Sample annotation — parse GA_N robustly from whatever survived in mat_z sample_meta <- data.frame( Sample = colnames(mat_z), SampleNum = as.integer(str_extract(colnames(mat_z), "(?<=GA_)\\d+")) ) %>% mutate(Condition = factor(case_when( SampleNum %in% 1:4 ~ "hApp", SampleNum %in% 5:8 ~ "hAppNLGF", SampleNum %in% 9:12 ~ "hAppNLGF_FIRE", SampleNum %in% 13:16 ~ "hApp_FIRE" ), levels = c("hApp", "hAppNLGF", "hApp_FIRE", "hAppNLGF_FIRE"))) stopifnot( ncol(mat_z) > 0, nrow(sample_meta) == ncol(mat_z), !anyNA(sample_meta$Condition) ) # Reorder mat_z and sample_meta together so they stay aligned samp_order <- order(sample_meta$Condition) mat_z <- mat_z[, samp_order, drop = FALSE] sample_meta <- sample_meta[samp_order, , drop = FALSE] col_anno <- HeatmapAnnotation( Condition = sample_meta$Condition, col = list(Condition = c( "hApp" = "#1b9e77", "hAppNLGF" = "#d95f02", "hApp_FIRE" = "#e7298a", "hAppNLGF_FIRE" = "#7570b3" )) ) ht <- Heatmap( mat_z, name = "z-score", col = colorRamp2(c(-2, 0, 2), c("navy", "white", "firebrick3")), top_annotation = col_anno, cluster_columns = FALSE, cluster_rows = TRUE, show_row_names = nrow(mat_z) <= 80, show_column_names = TRUE, row_names_gp = gpar(fontsize = 7), column_names_gp = gpar(fontsize = 9), column_split = sample_meta$Condition, column_title_gp = gpar(fontsize = 10, fontface = "bold"), heatmap_legend_param = list(title = "z-score (log2 abundance)") ) draw(ht) pdf(file.path(interaction_dir, "Heatmap_microglia_attributable_NLGF_modulated.pdf"), width = 8, height = max(6, min(20, nrow(mat_z) * 0.18))) draw(ht) dev.off() cat("Heatmap proteins:", nrow(mat_z), "\n") ```