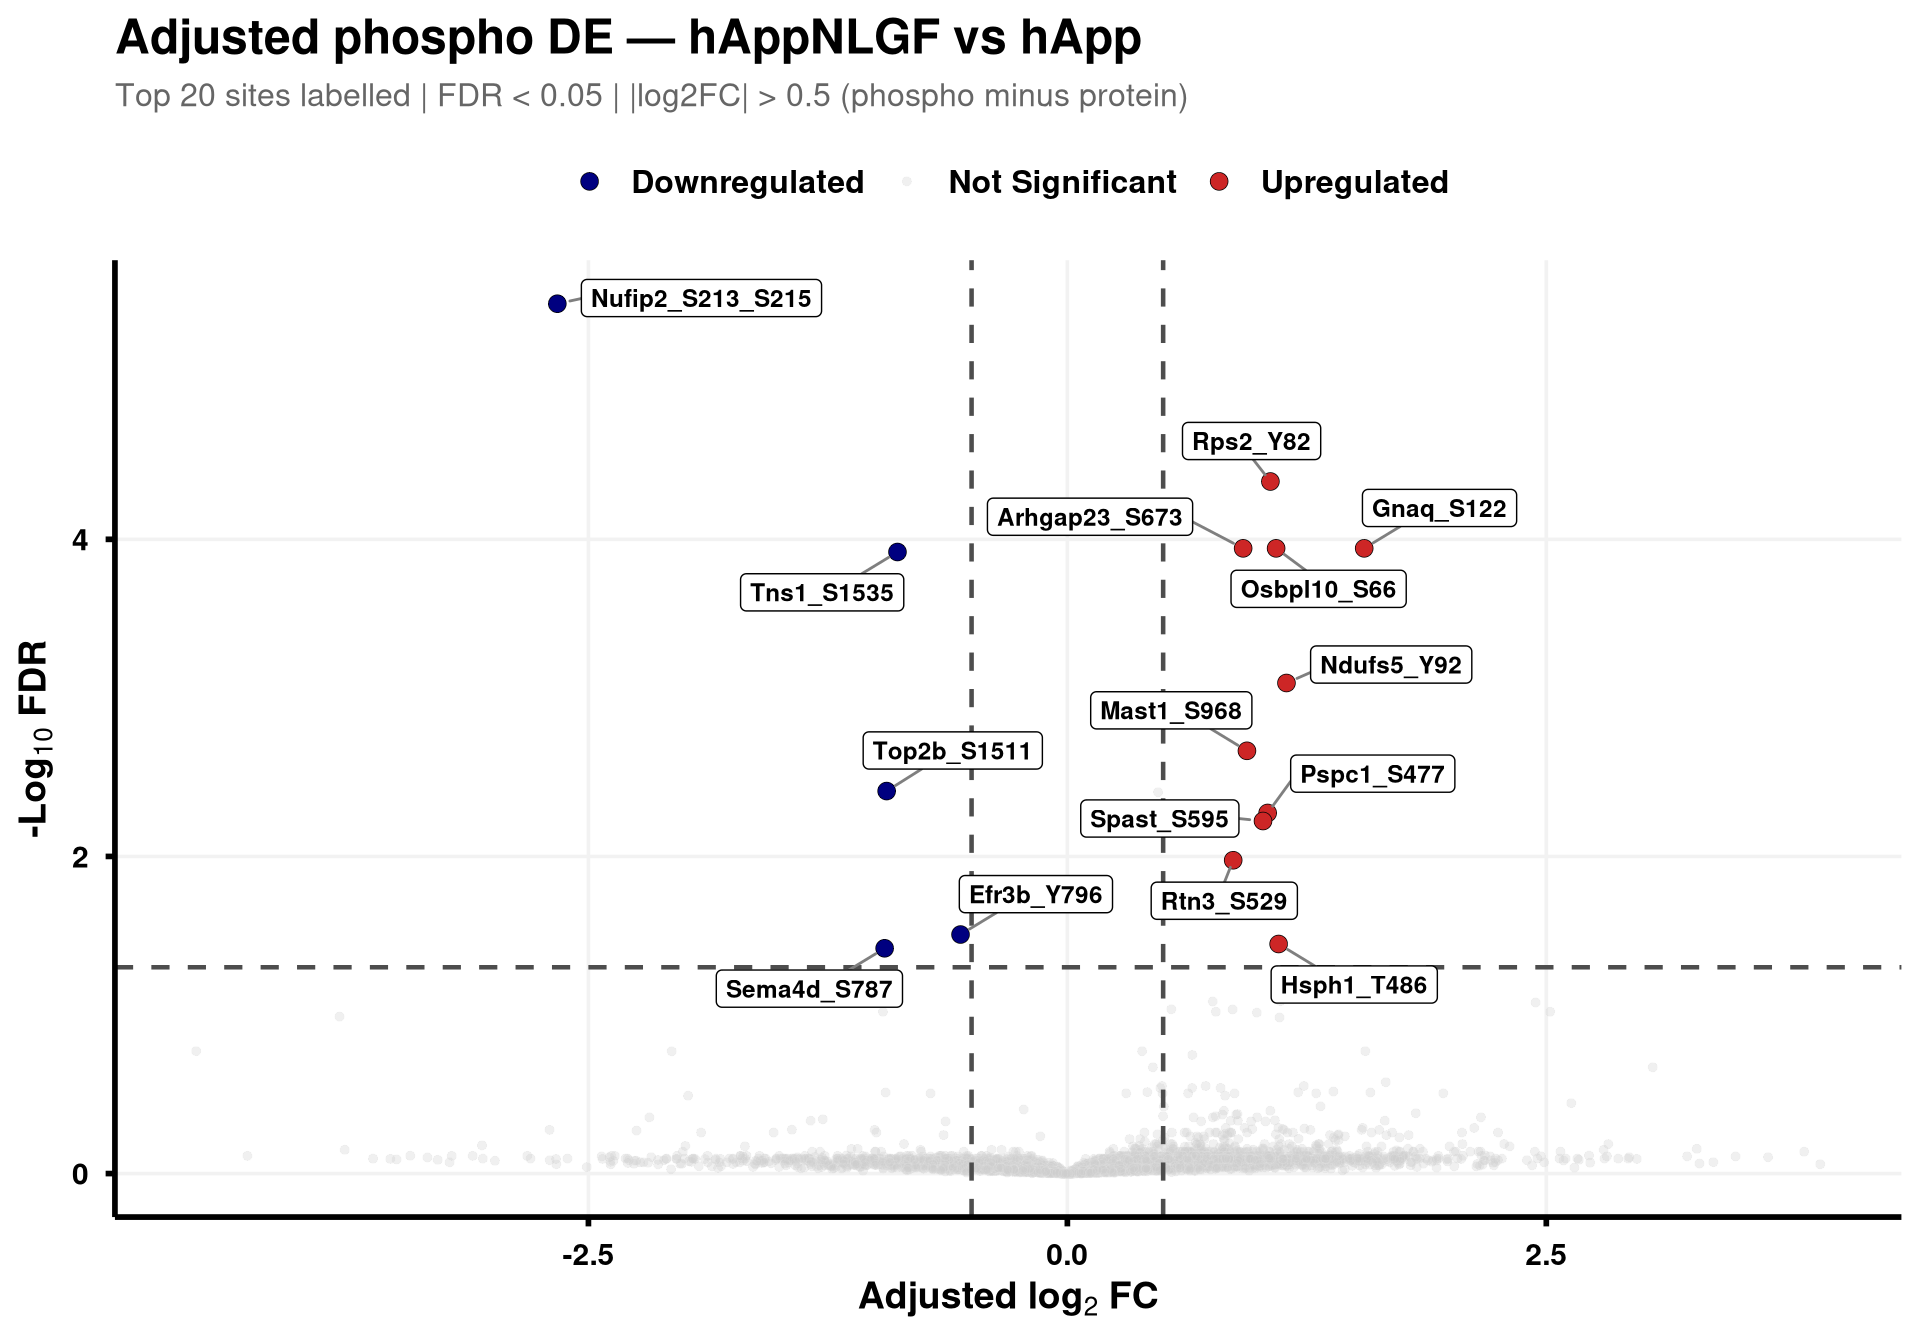
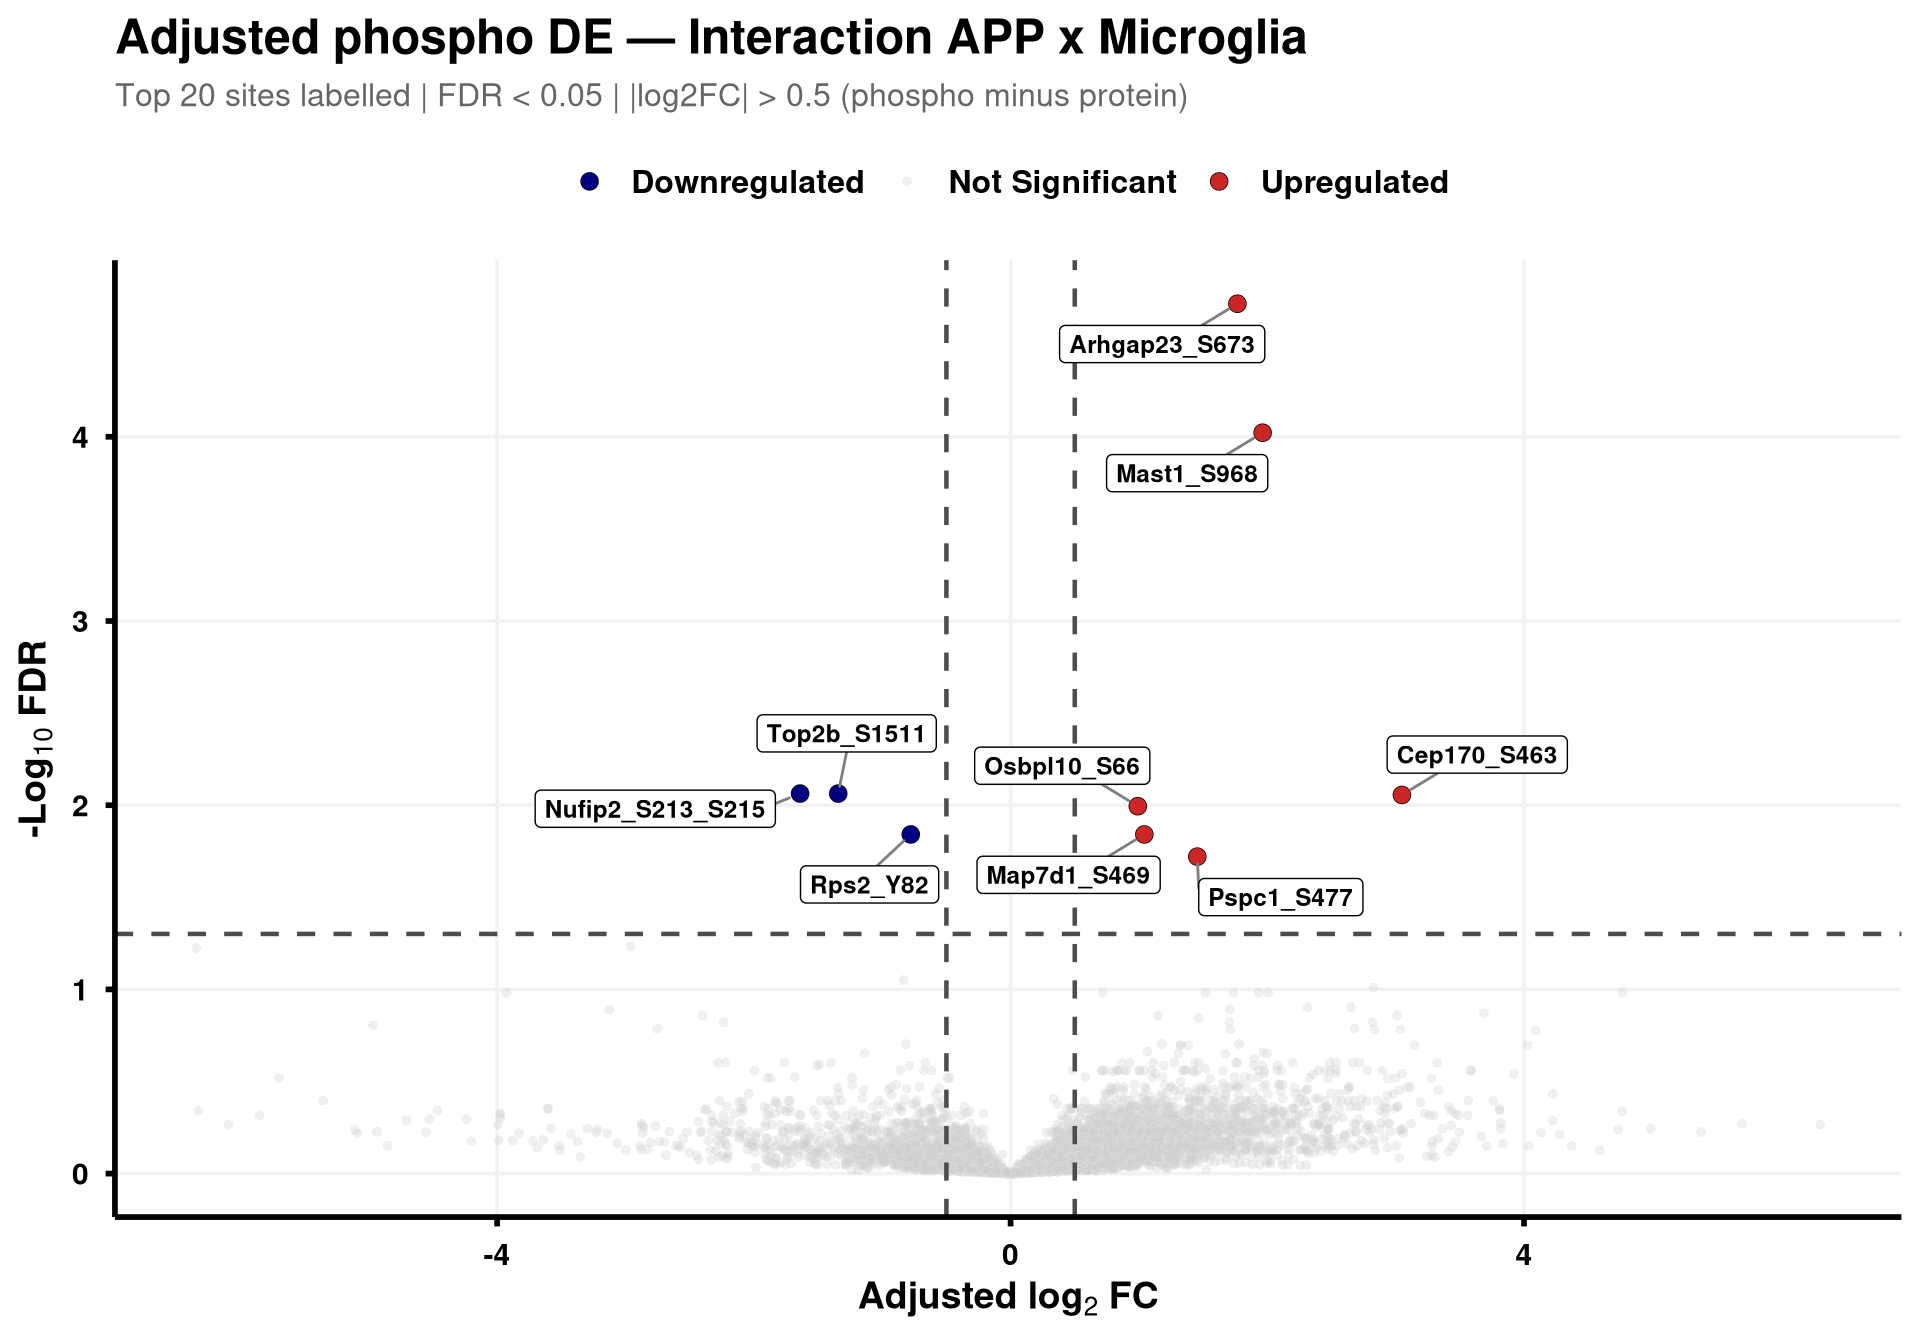
--- title: "3. Phospho — DE volcanoes (adjusted)" --- ## Overview `Gene_Sxxx` format (e.g. `Mapt_S202` ) when the FASTA mapping in notebook 02 succeeded; otherwise the raw protein/peptide identifier is used.## Libraries ```{r setup, include=FALSE, message=FALSE} library(data.table) library(qs2) library(dplyr) library(ggplot2) library(ggrepel) library(stringr) library(AnnotationDbi) library(org.Mm.eg.db) ``` ## Directories ```{r} <- "/nemo/lab/destrooperb/home/shared/zanettc/giulia_proteomics/phosphoproteomics" <- "run3" <- file.path (base_dir, "results" , run_num)<- file.path (base_dir, "data" , "processed" , run_num)dir.create (results_dir, recursive = TRUE , showWarnings = FALSE )``` ## Load adjusted PTM contrast table ```{r load} res_df <- fread(file.path(results_dir, "PTM_adjusted_GroupComparison.csv")) cat("Rows:", nrow(res_df), " Contrasts:", paste(unique(res_df$Label), collapse = ", "), "\n") # MSstatsPTM puts site identifier in `Protein` (e.g. UniProt_S202_T205); split out # the UniProt accession to map to a gene symbol. The exact format depends on the # FASTA-mapping success in notebook 02 — adjust the regex if your sites look # different. res_df[, Accession := str_extract(Protein, "^[^_;]+")] res_df[, Sites_in_id := str_extract(Protein, "(?<=_)[STY][0-9]+(?:_[STY][0-9]+)*")] # Map UniProt accession → gene symbol res_df[, Gene := mapIds( org.Mm.eg.db, keys = Accession, column = "SYMBOL", keytype = "UNIPROT", multiVals = "first" )] res_df[, Gene := ifelse(is.na(Gene) | Gene == "", Accession, Gene)] res_df[, SiteLabel := ifelse(is.na(Sites_in_id), Gene, paste0(Gene, "_", Sites_in_id))] ``` ## Volcano helper (mirrors bulk's `generate_swanky_volcano`) ```{r volcano_fn} volcano_cols <- c("Upregulated" = "firebrick3", "Downregulated" = "navy", "Not Significant" = "grey80") generate_phospho_volcano <- function(df, comparison_label, logfc_cutoff = 0.5, graphs_dir = results_dir) { v <- df %>% filter(Label == comparison_label, !is.na(adj.pvalue), is.finite(log2FC)) %>% mutate( Status = case_when( adj.pvalue < 0.05 & log2FC > logfc_cutoff ~ "Upregulated", adj.pvalue < 0.05 & log2FC < -logfc_cutoff ~ "Downregulated", TRUE ~ "Not Significant" ) ) %>% group_by(Status) %>% mutate(GroupRank = rank(adj.pvalue, ties.method = "first")) %>% ungroup() %>% mutate(PlotLabel = ifelse(Status != "Not Significant" & GroupRank <= 20, SiteLabel, NA_character_)) p <- ggplot(v, aes(x = log2FC, y = -log10(adj.pvalue), fill = Status, color = Status)) + geom_point(aes(size = Status, alpha = Status), shape = 21, stroke = 0.2) + scale_fill_manual(values = volcano_cols) + scale_color_manual(values = c("Upregulated" = "black", "Downregulated" = "black", "Not Significant" = "grey90")) + scale_size_manual(values = c("Upregulated" = 3, "Downregulated" = 3, "Not Significant" = 1.5)) + scale_alpha_manual(values = c("Upregulated" = 1, "Downregulated" = 1, "Not Significant" = 0.3)) + geom_hline(yintercept = -log10(0.05), linetype = "dashed", color = "grey30", linewidth = 0.8) + geom_vline(xintercept = c(-logfc_cutoff, logfc_cutoff), linetype = "dashed", color = "grey30", linewidth = 0.8) + geom_label_repel(aes(label = PlotLabel), fill = "white", color = "black", fontface = "bold", size = 3.2, box.padding = 0.5, point.padding = 0.5, min.segment.length = 0, segment.color = "grey50", max.overlaps = 50) + labs(title = paste0("Adjusted phospho DE — ", gsub("_", " ", comparison_label)), subtitle = paste0("Top 20 sites labelled | FDR < 0.05 | |log2FC| > ", logfc_cutoff, " (phospho minus protein)"), x = bquote(bold("Adjusted log"[2] ~ "FC")), y = bquote(bold("-Log"[10] ~ "FDR"))) + theme_minimal(base_size = 14) + theme(plot.title = element_text(face = "bold", size = 18, hjust = 0), plot.subtitle = element_text(size = 12, color = "grey40", margin = margin(b = 10)), axis.title = element_text(face = "bold", size = 14), axis.text = element_text(face = "bold", color = "black"), axis.line = element_line(color = "black", linewidth = 1), axis.ticks = element_line(color = "black", linewidth = 1), legend.position = "top", legend.title = element_blank(), legend.text = element_text(size = 12, face = "bold"), panel.grid.minor = element_blank(), panel.grid.major = element_line(color = "grey95")) safe <- gsub(" ", "_", comparison_label) ggsave(file.path(graphs_dir, paste0("PhosphoVolcano_", safe, ".pdf")), p, width = 10, height = 7, dpi = 300, device = cairo_pdf) fwrite(v %>% dplyr::select(SiteLabel, Gene, Accession, Sites_in_id, log2FC, pvalue, adj.pvalue, Status) %>% arrange(adj.pvalue), file.path(graphs_dir, paste0("PhosphoVolcano_Data_", safe, ".csv"))) p } ``` ## Iterate through contrasts ```{r run_volcanoes, fig.width=10, fig.height=7} for (cl in unique(res_df$Label)) { print(generate_phospho_volcano(res_df, cl, logfc_cutoff = 0.5, graphs_dir = results_dir)) } ``` ## Quick sanity check — bulk vs phospho concordance `phospho − protein` contrast in notebook 02), not by unadjusted FDR. MSstatsPTM gives `oneConditionMissing` / `completeMissing` sites a sentinel `log2FC = ±Inf` and `p = 0` , which dominate the unadjusted FDR call but carry no real biological signal — they're filtered out here.```{r concordance, fig.width=10, fig.height=8} ptm_unadj <- fread(file.path(results_dir, "PTM_unadjusted_GroupComparison.csv")) prot_res <- fread(file.path(results_dir, "PROTEIN_GroupComparison.csv")) ptm_unadj[, Accession := str_extract(Protein, "^[^_;]+")] prot_res[, Accession := str_extract(Protein, "^[^;]+")] cmp <- merge( ptm_unadj[, .(Label, SiteProtein = Protein, Accession, Phospho_log2FC = log2FC, Phospho_issue = issue)], prot_res[, .(Label, Accession, Protein_log2FC = log2FC)], by = c("Label", "Accession") ) # Bring in adjusted (phospho − protein) FDR from notebook 02 — `res_df` is already # loaded above. SiteProtein matches the adjusted table's `Protein` column. cmp <- merge( cmp, res_df[, .(Label, SiteProtein = Protein, Adj_padj = adj.pvalue)], by = c("Label", "SiteProtein"), all.x = TRUE ) cmp_plot <- cmp[is.finite(Phospho_log2FC) & is.finite(Protein_log2FC)] cmp_plot[, Significant := !is.na(Adj_padj) & Adj_padj < 0.05] cat("Sentinel rows dropped:", nrow(cmp) - nrow(cmp_plot), " | retained:", nrow(cmp_plot), " | significant (adj FDR < 0.05):", sum(cmp_plot$Significant), "\n") p_scat <- ggplot(cmp_plot, aes(Protein_log2FC, Phospho_log2FC, color = Significant)) + geom_point(alpha = 0.5, size = 1) + geom_abline(slope = 1, intercept = 0, linetype = "dashed", color = "grey30") + geom_hline(yintercept = 0, linetype = "dotted", color = "grey60") + geom_vline(xintercept = 0, linetype = "dotted", color = "grey60") + scale_color_manual(values = c("TRUE" = "firebrick3", "FALSE" = "grey60"), labels = c("TRUE" = "Significant", "FALSE" = "n.s."), name = "Adjusted phospho FDR < 0.05") + facet_wrap(~ Label, ncol = 3, scales = "free") + labs(title = "Phospho vs Protein log2FC per contrast", subtitle = "Coloured by adjusted (phospho − protein) FDR; MSstats sentinel sites removed", x = "Protein log2FC (bulk)", y = "Phospho log2FC (unadjusted)") + theme_bw(base_size = 11) + theme(legend.position = "top", strip.text = element_text(face = "bold")) print(p_scat) ggsave(file.path(results_dir, "Phospho_vs_Protein_log2FC_scatter.pdf"), p_scat, width = 12, height = 8, device = cairo_pdf) ```