Code
base_dir <- "/nemo/lab/destrooperb/home/shared/zanettc/giulia_proteomics/bulk_proteomics"
run_num <- "run4"
results_dir <- file.path(base_dir, "results", run_num)
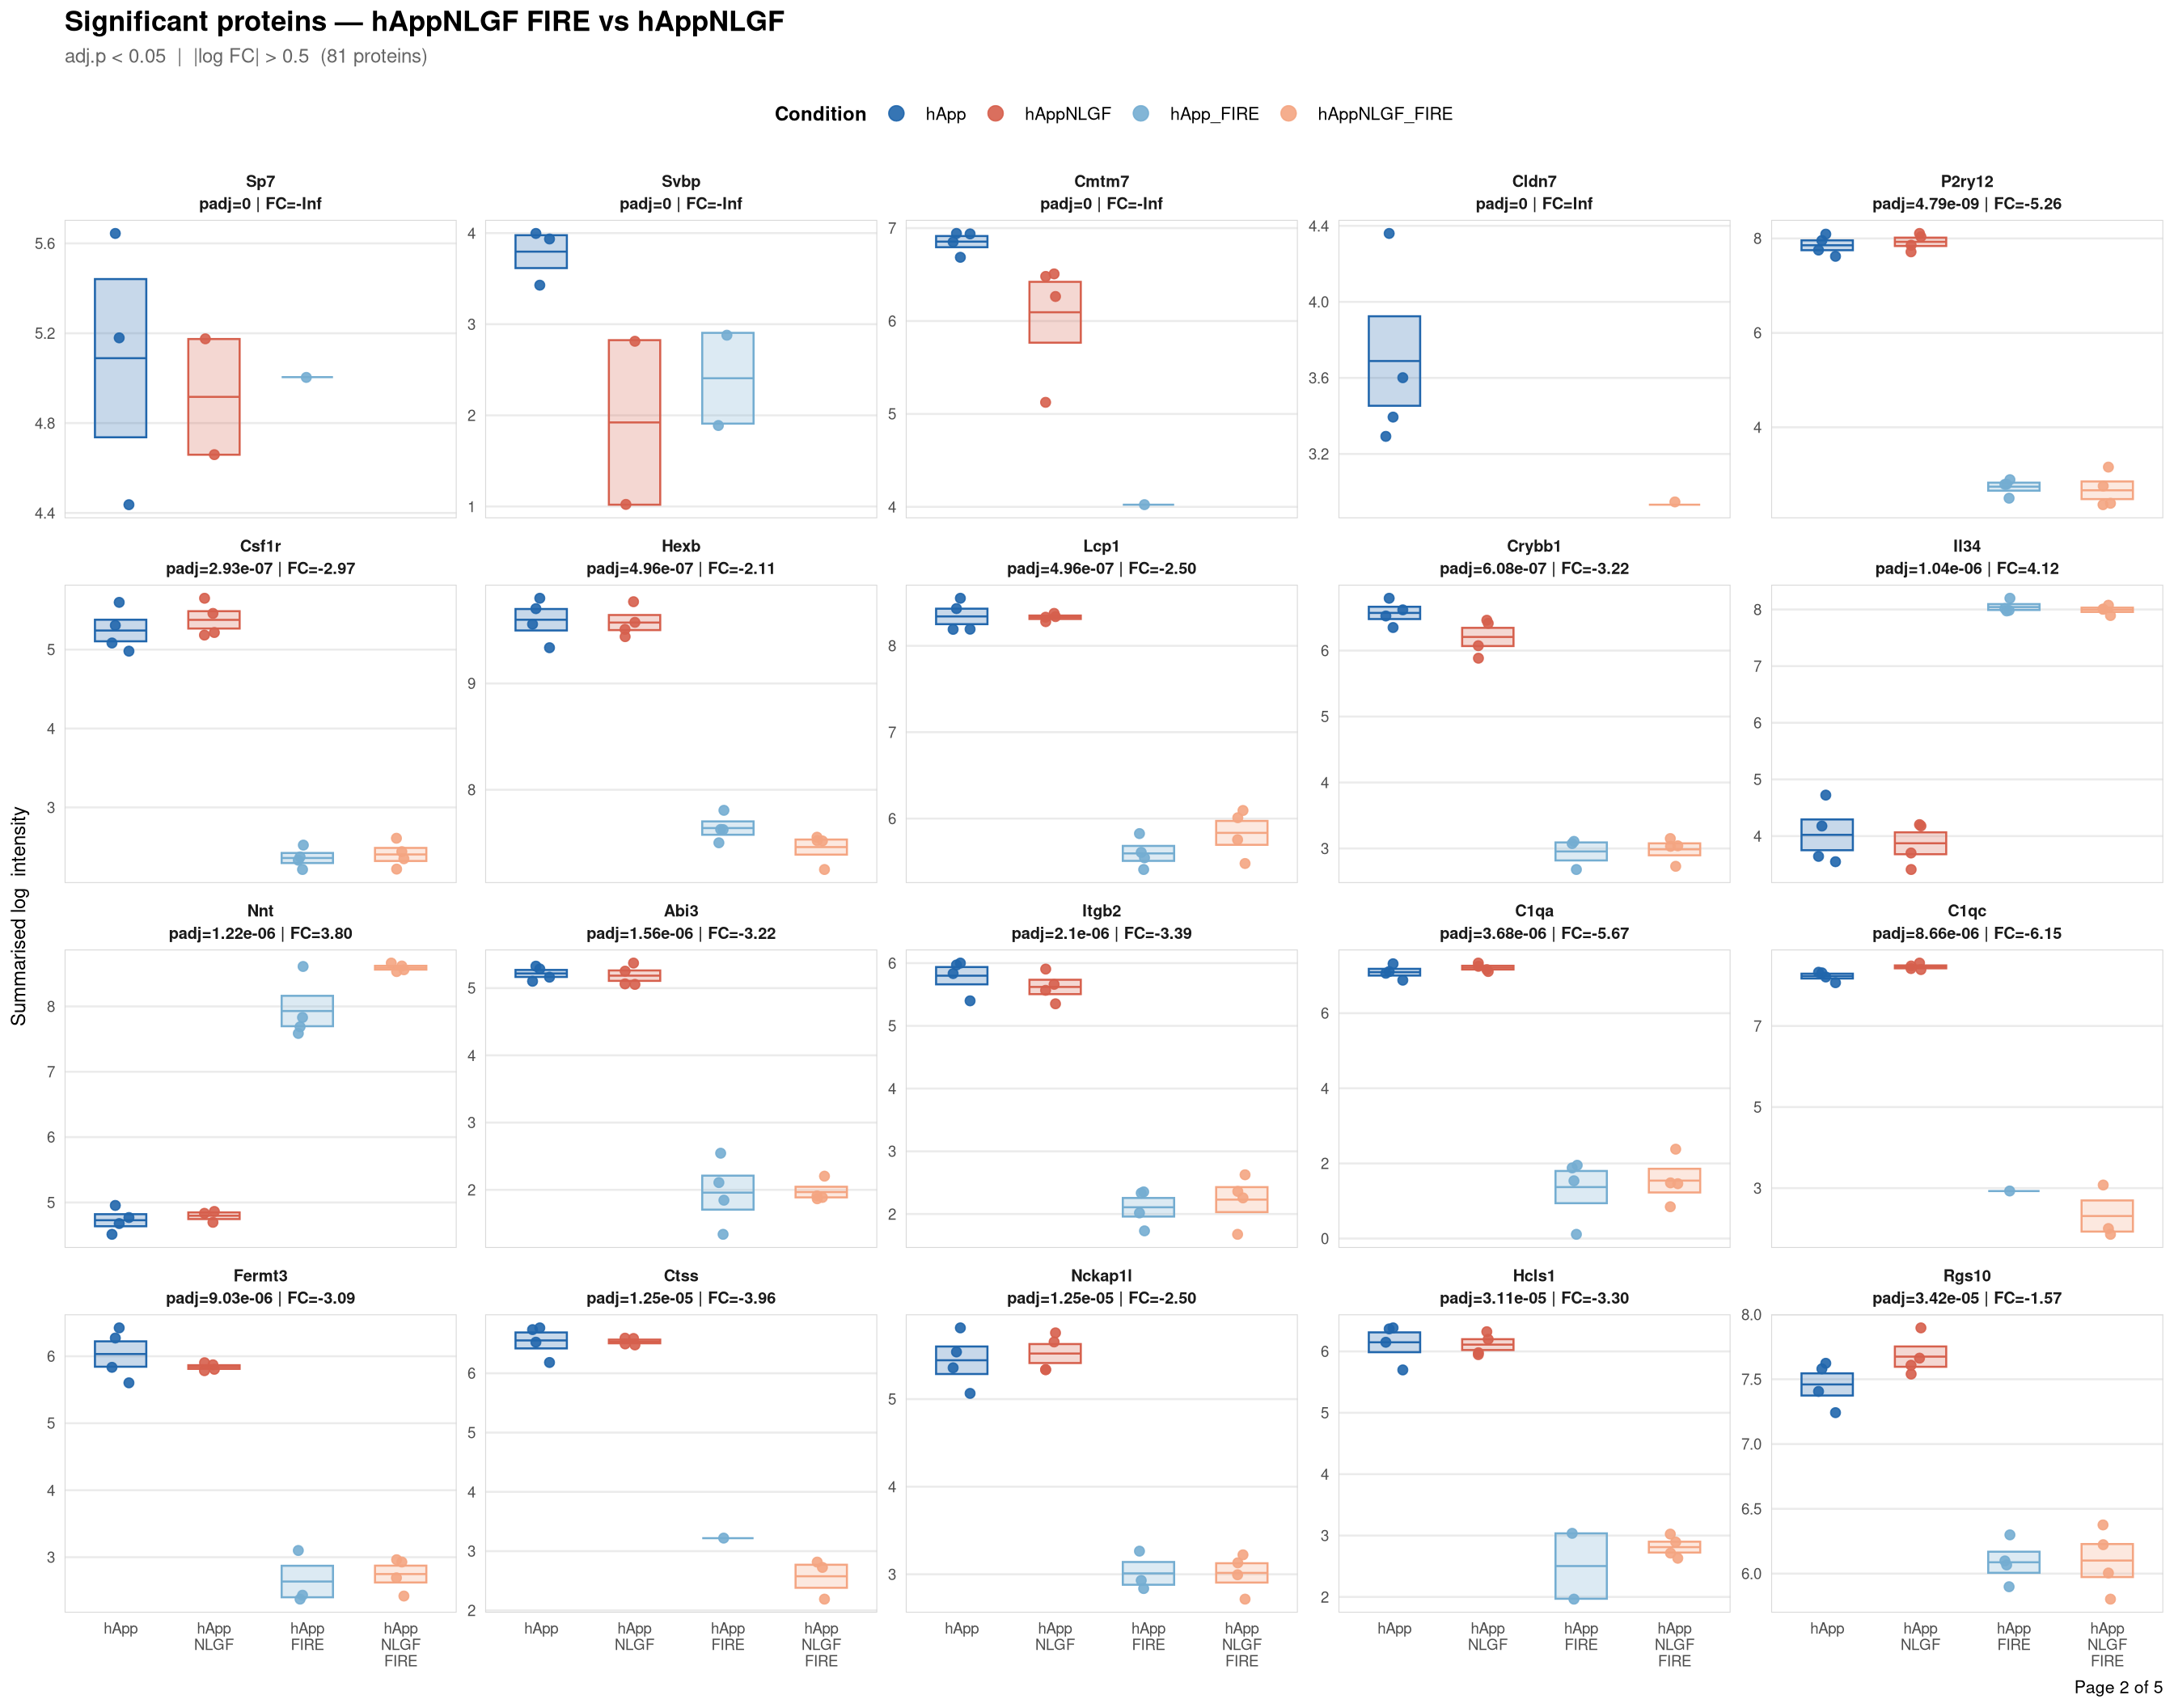
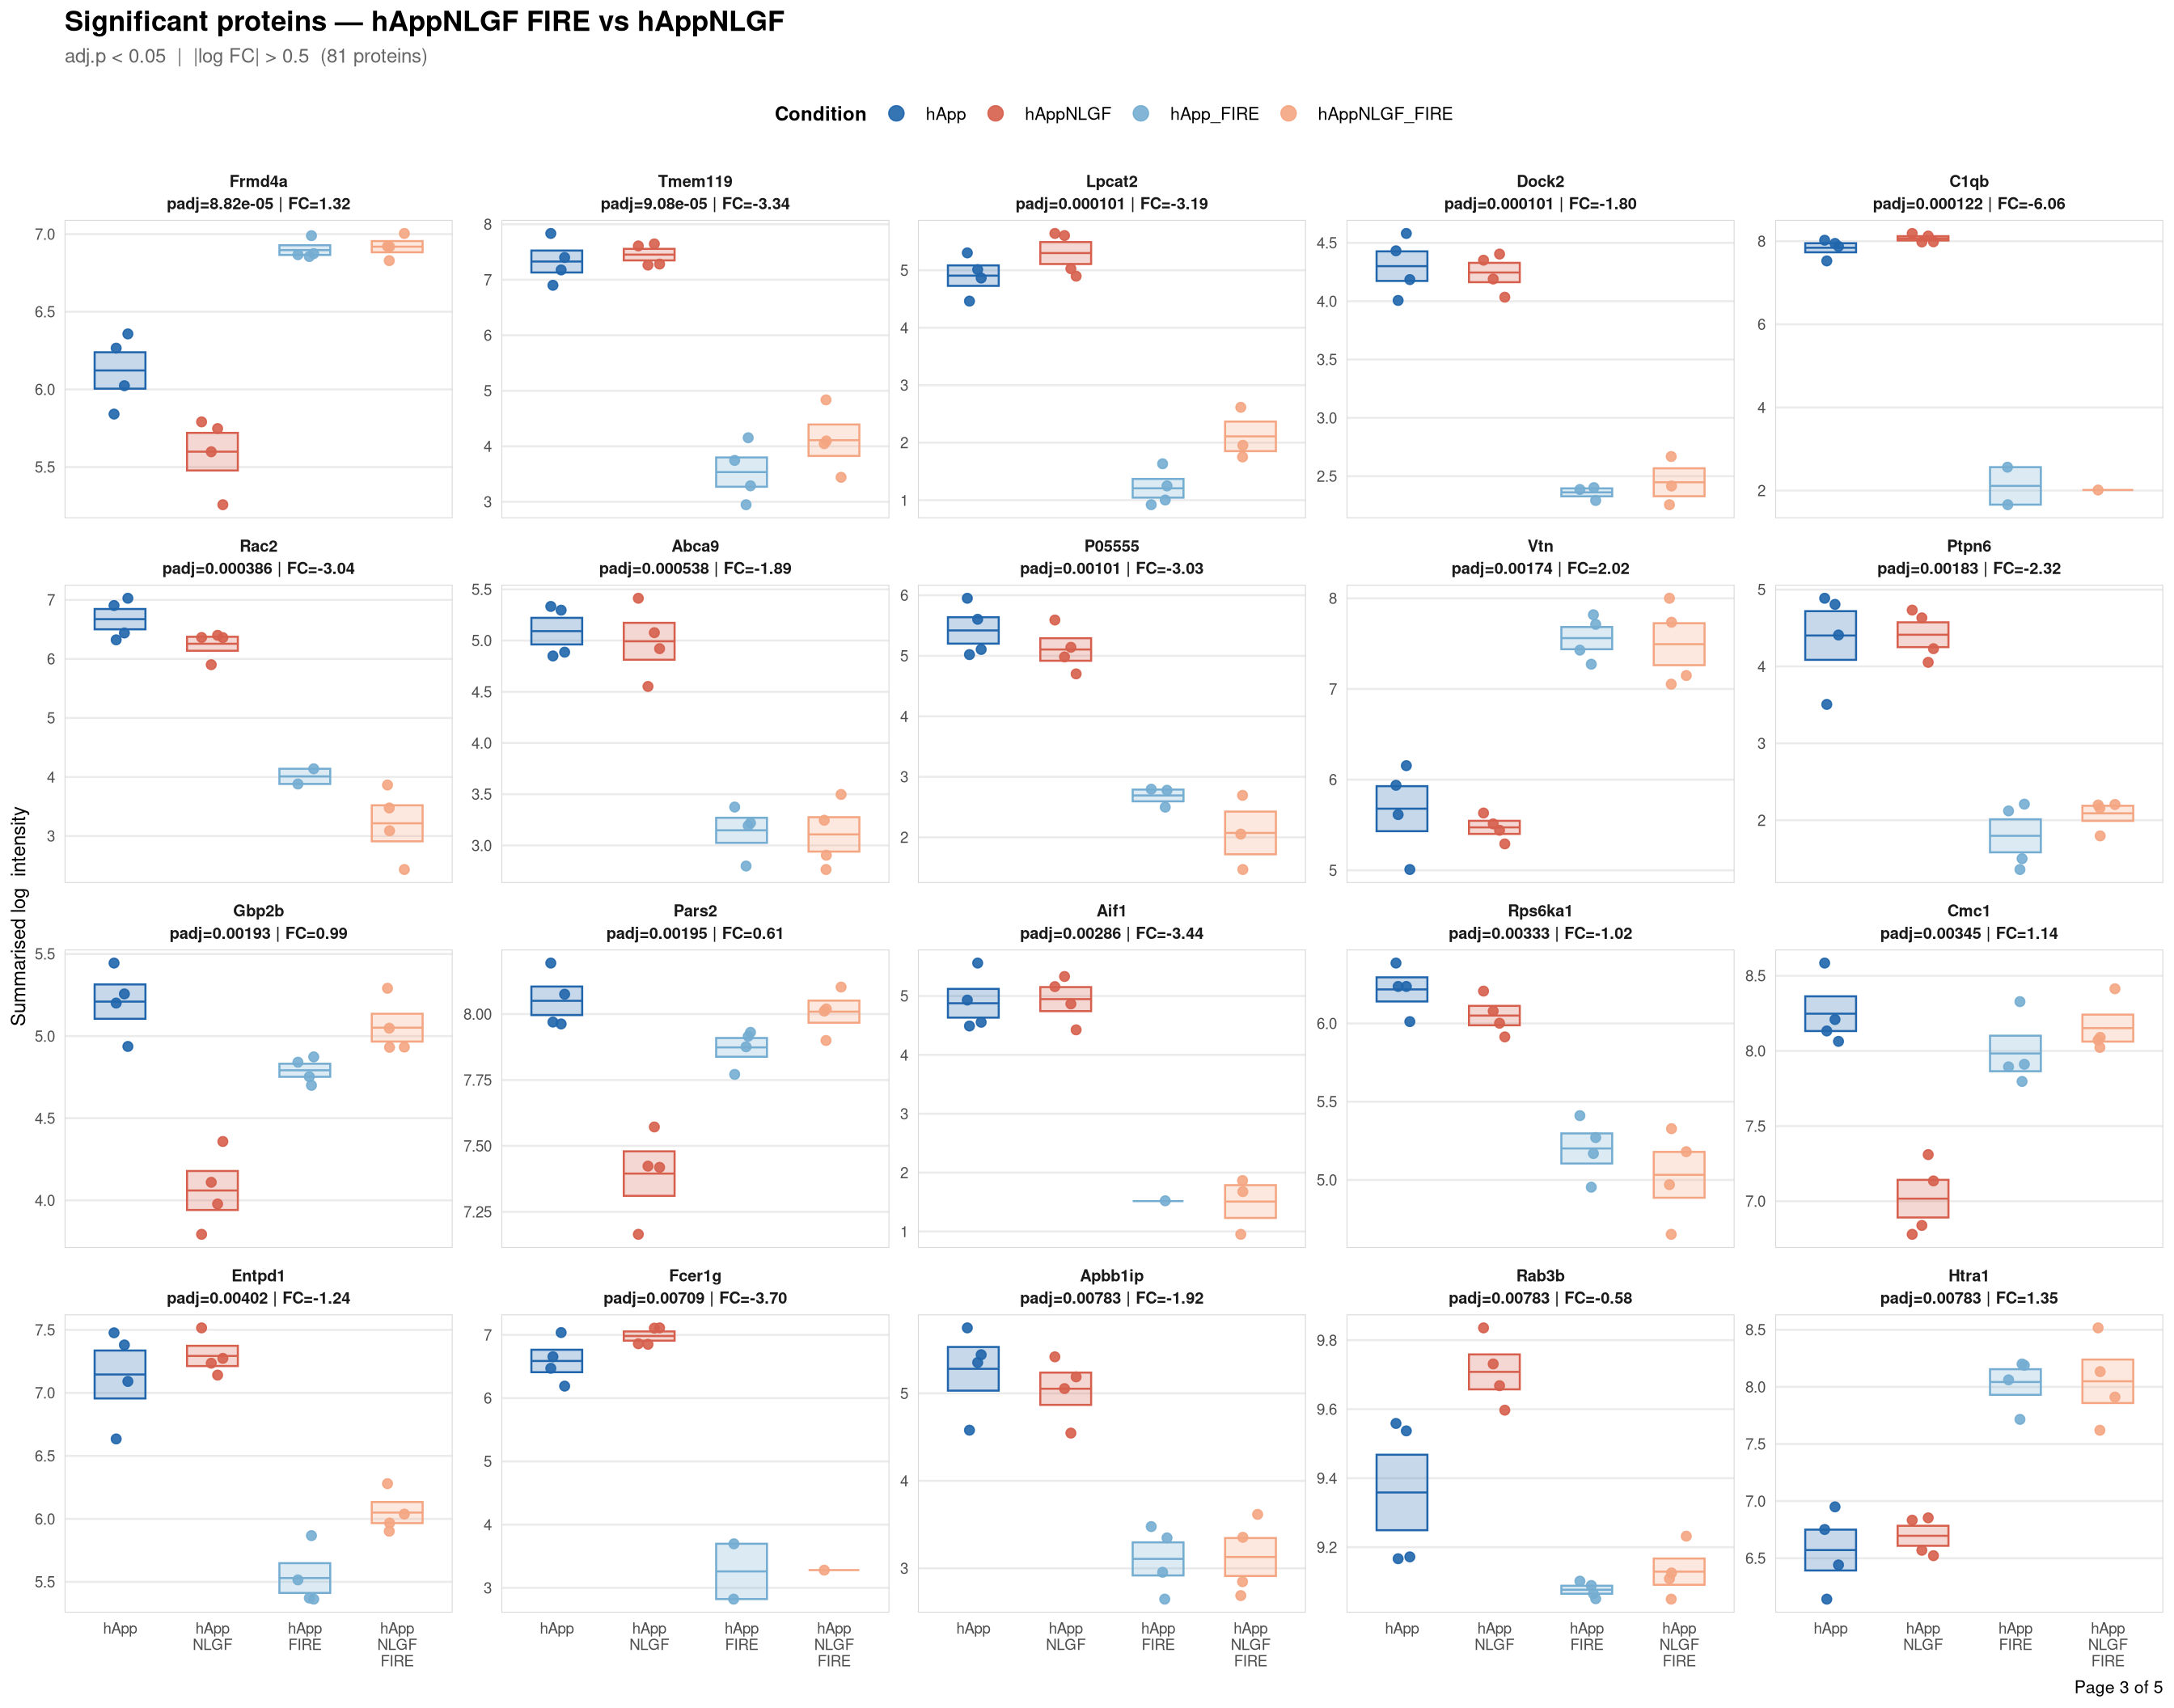
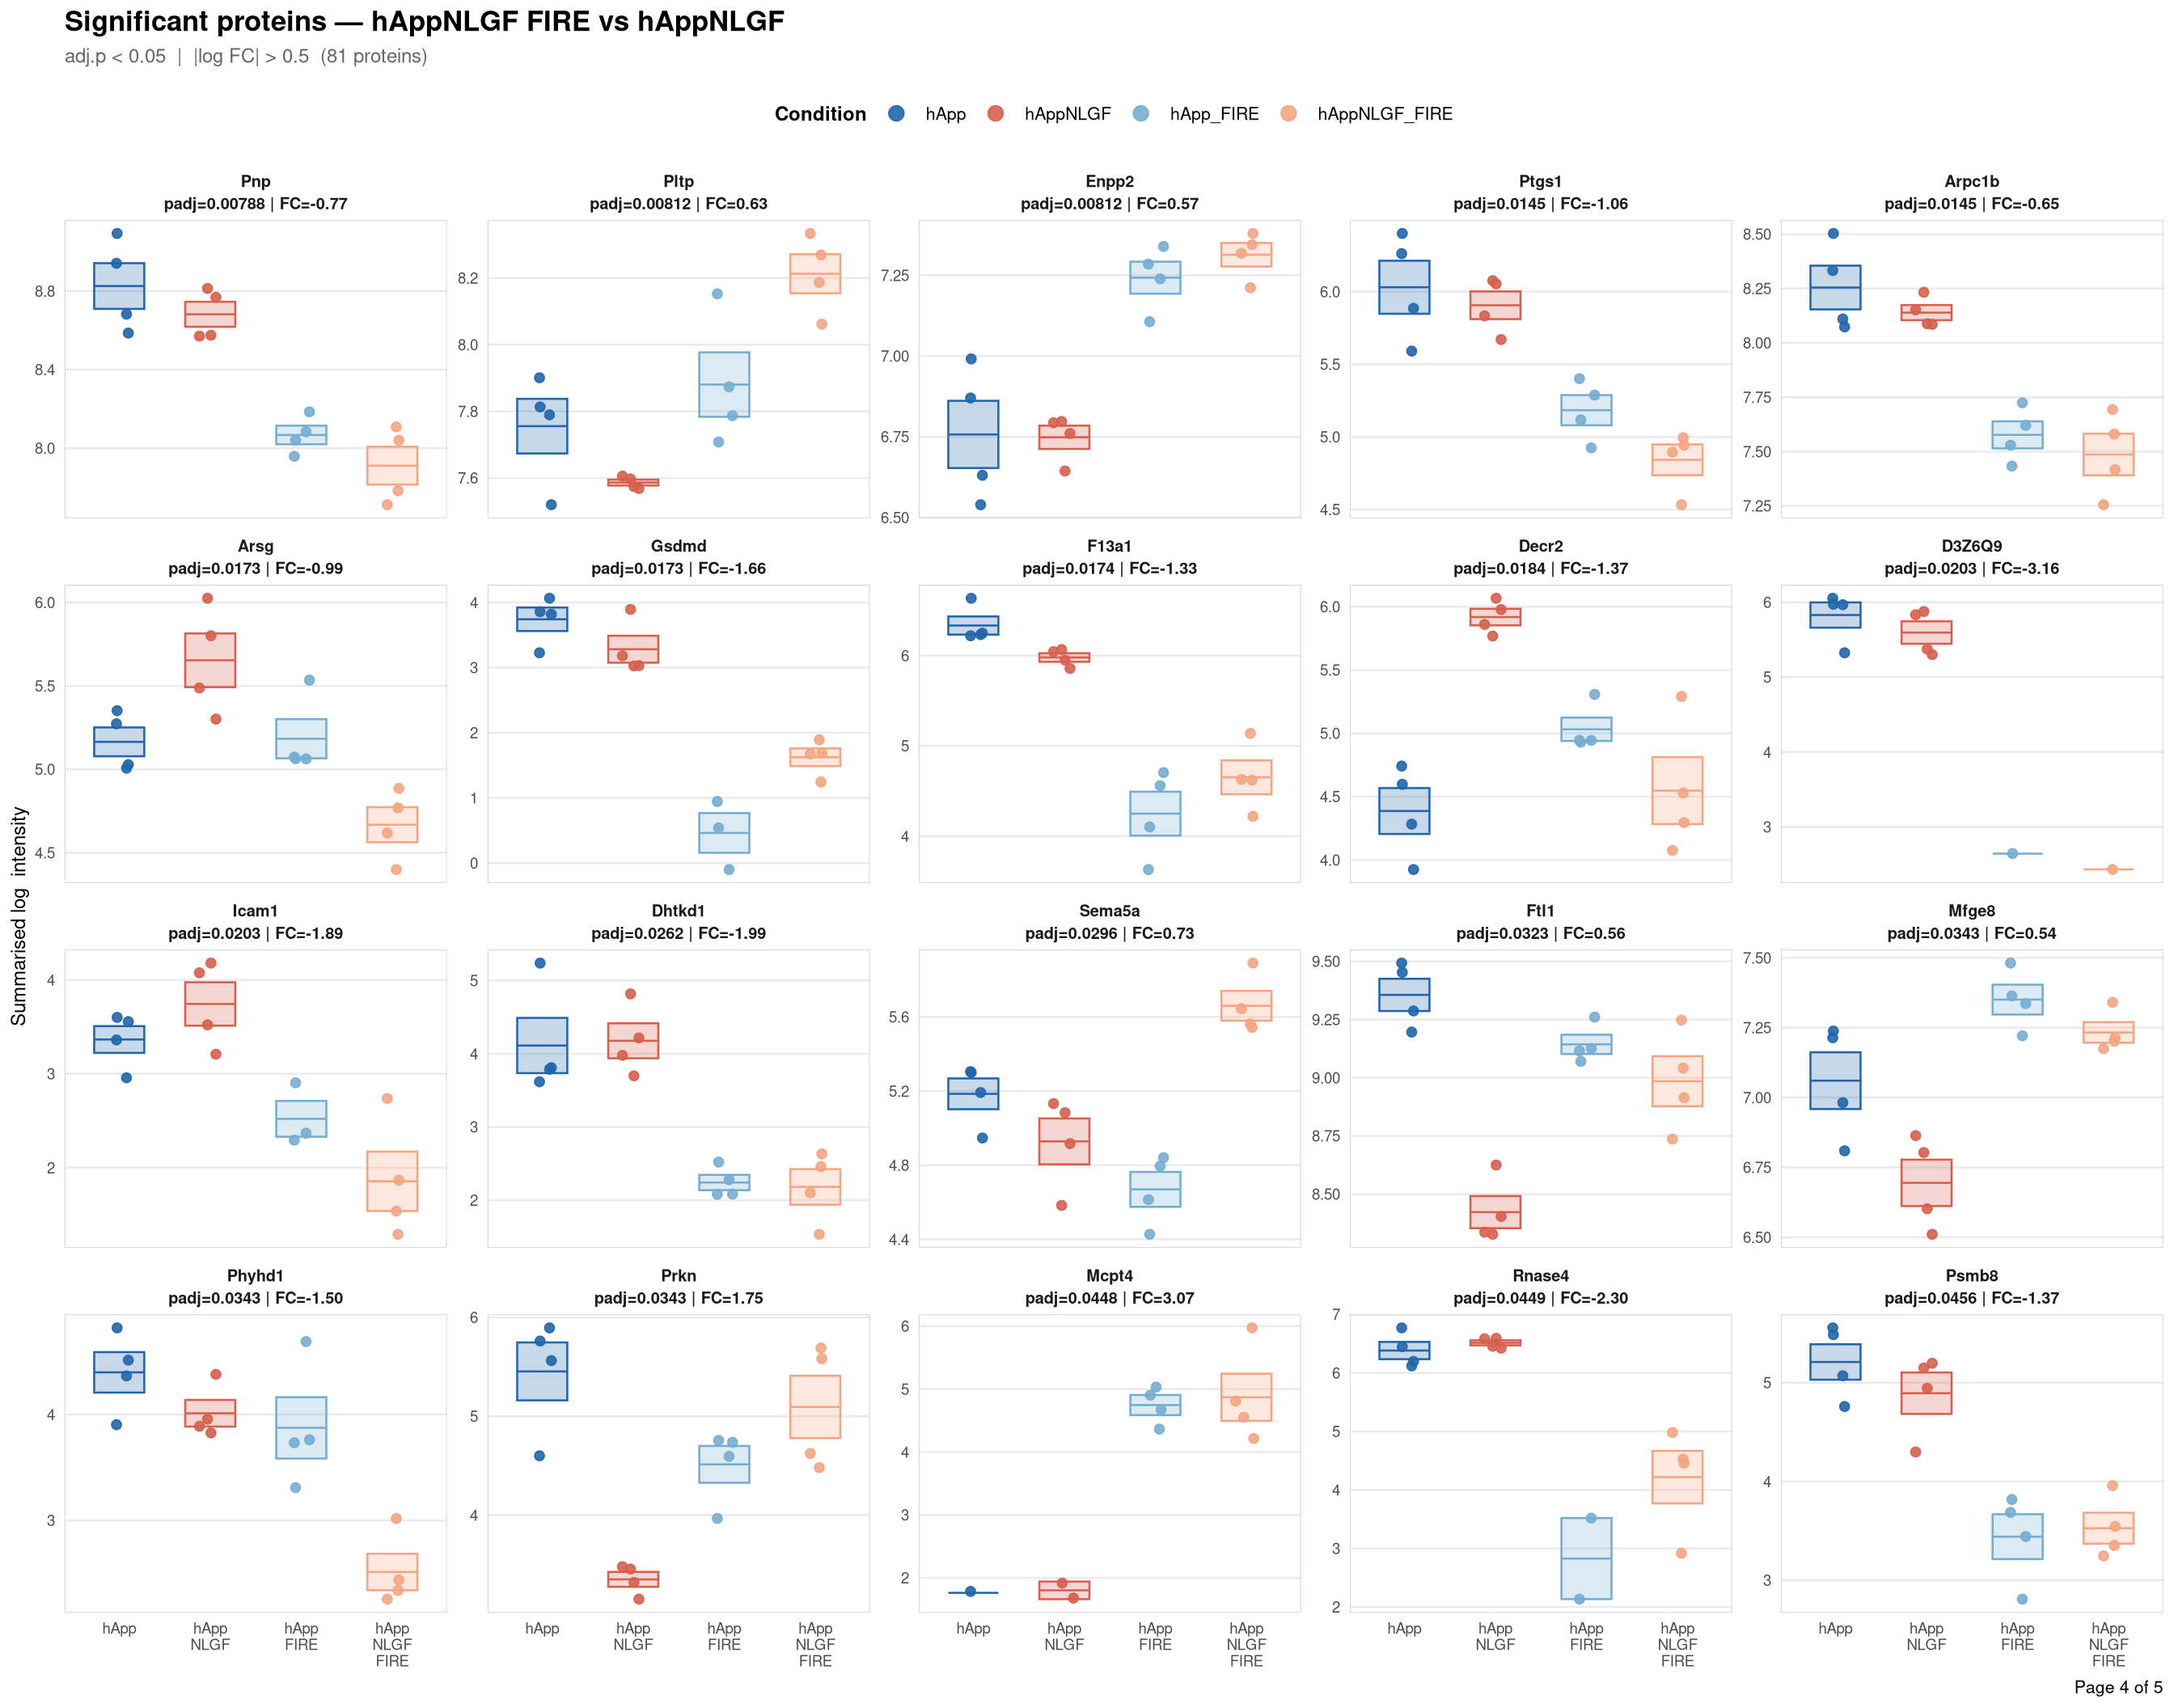
objects_dir <- file.path(base_dir, "data", "processed", run_num)Per-protein intensity profiles for all significant DE proteins (FDR < 0.05, |log2FC| > 0.5) in each contrast. Each panel shows the MSstats-summarised log₂ intensity across the four conditions, with individual replicate points and a mean ± SE crossbar. Panels are ordered by adjusted p-value (most significant first) and paginated at 20 proteins per page.
Inputs:
Full_GroupComparison_Results.csv — MSstats DE results from notebook 02processed_msstats_data.qs2 → $ProteinLevelData — per-run summarised log₂ intensitiesprotein_dictionary.csv — UniProt → gene symbol mapping built in notebook 03Thresholds match notebook 03 (volcano): FDR < 0.05, |log2FC| > 0.5.
base_dir <- "/nemo/lab/destrooperb/home/shared/zanettc/giulia_proteomics/bulk_proteomics"
run_num <- "run4"
results_dir <- file.path(base_dir, "results", run_num)
objects_dir <- file.path(base_dir, "data", "processed", run_num)Same 2×2 factorial colour scheme as the phospho profile plots (notebook 06b).
COND_ORDER <- c("hApp", "hAppNLGF", "hApp_FIRE", "hAppNLGF_FIRE")

cond_cols <- c(
  hApp          = "#2166AC",
  hAppNLGF      = "#D6604D",
  hApp_FIRE     = "#74ADD1",
  hAppNLGF_FIRE = "#F4A582"
)

cond_labels <- c(
  hApp          = "hApp",
  hAppNLGF      = "hApp\nNLGF",
  hApp_FIRE     = "hApp\nFIRE",
  hAppNLGF_FIRE = "hApp\nNLGF\nFIRE"
)de <- fread(file.path(results_dir, "Full_GroupComparison_Results.csv"))
prot_dict <- fread(file.path(objects_dir, "protein_dictionary.csv"),
select = c("Protein", "Gene"))
prot_dict <- unique(prot_dict)
de <- merge(de, prot_dict, by = "Protein", all.x = TRUE)
de[, Gene := ifelse(is.na(Gene) | Gene == "", Protein, Gene)]
ADJ_PVAL_CUTOFF <- 0.05
LOGFC_CUTOFF <- 0.5
de_sig <- de[adj.pvalue < ADJ_PVAL_CUTOFF & abs(log2FC) > LOGFC_CUTOFF]
cat("Significant proteins per contrast:\n")Significant proteins per contrast:print(de_sig[, .N, by = Label][order(Label)]) Label N
<char> <int>
1: Interaction_APP_x_Microglia 40
2: hAppNLGF_FIRE_vs_hAppNLGF 81
3: hAppNLGF_FIRE_vs_hApp_FIRE 33
4: hAppNLGF_vs_hApp 31
5: hApp_FIRE_vs_hApp 99summ <- qs_read(file.path(objects_dir, "processed_msstats_data.qs2"))
pld <- as.data.table(summ$ProteinLevelData)
pld[, GROUP := factor(GROUP, levels = COND_ORDER)]
cat("ProteinLevelData rows:", nrow(pld),
" | unique proteins:", uniqueN(pld$Protein), "\n")ProteinLevelData rows: 140794 | unique proteins: 8890 PAGE_SIZE <- 20
make_profiles <- function(contrast_label) {
sig_ct <- de_sig[Label == contrast_label][order(adj.pvalue)]
n_sig <- nrow(sig_ct)
if (n_sig == 0) {
message("No significant proteins for ", contrast_label, " — skipping.")
return(invisible(NULL))
}
sig_ct[, FacetLabel := sprintf(
"%s\npadj=%.3g | FC=%.2f", Gene, adj.pvalue, log2FC
)]
sig_ct[, FacetLabel := factor(FacetLabel, levels = unique(FacetLabel))]
pld_sig <- pld[Protein %in% sig_ct$Protein]
pld_sig <- merge(pld_sig,
sig_ct[, .(Protein, FacetLabel)],
by = "Protein")
pld_sig[, FacetLabel := factor(FacetLabel, levels = levels(sig_ct$FacetLabel))]
n_pages <- ceiling(n_sig / PAGE_SIZE)
safe <- gsub(" ", "_", contrast_label)
pdf_path <- file.path(results_dir, glue("ProteinProfiles_{safe}.pdf"))
plots <- vector("list", n_pages)
cairo_pdf(pdf_path, onefile = TRUE, width = 14, height = 11)
for (pg in seq_len(n_pages)) {
idx_lo <- (pg - 1L) * PAGE_SIZE + 1L
idx_hi <- min(pg * PAGE_SIZE, n_sig)
pg_sites <- levels(sig_ct$FacetLabel)[idx_lo:idx_hi]
pg_data <- pld_sig[FacetLabel %in% pg_sites]
pg_data[, FacetLabel := factor(FacetLabel, levels = pg_sites)]
ncol_n <- min(5L, length(pg_sites))
page_caption <- if (n_pages > 1) glue("Page {pg} of {n_pages}") else NULL
p <- ggplot(pg_data,
aes(x = GROUP, y = LogIntensities, colour = GROUP)) +
stat_summary(fun.data = mean_se,
geom = "crossbar",
mapping = aes(fill = GROUP),
width = 0.55,
linewidth = 0.45,
fatten = 1,
alpha = 0.25,
show.legend = FALSE) +
geom_jitter(width = 0.12, size = 1.8, alpha = 0.9) +
scale_colour_manual(values = cond_cols, limits = COND_ORDER) +
scale_fill_manual(values = cond_cols, limits = COND_ORDER) +
scale_x_discrete(limits = COND_ORDER, labels = cond_labels) +
facet_wrap(~ FacetLabel, ncol = ncol_n, scales = "free_y") +
labs(
x = NULL,
y = "Summarised log₂ intensity",
title = glue("Significant proteins — {gsub('_', ' ', contrast_label)}"),
subtitle = glue(
"adj.p < {ADJ_PVAL_CUTOFF} | |log₂FC| > {LOGFC_CUTOFF} ",
"({n_sig} protein{ifelse(n_sig==1,'','s')})"
),
caption = page_caption,
colour = "Condition"
) +
theme_minimal(base_size = 10) +
theme(
plot.title = element_text(face = "bold", size = 13, hjust = 0),
plot.subtitle = element_text(size = 9, colour = "grey40",
margin = margin(b = 8)),
strip.text = element_text(face = "bold", size = 7.5,
lineheight = 1.15),
axis.text.x = element_text(size = 7, lineheight = 0.9),
axis.text.y = element_text(size = 7),
axis.title.y = element_text(size = 9),
panel.grid.minor = element_blank(),
panel.grid.major.x = element_blank(),
panel.border = element_rect(colour = "grey85", fill = NA,
linewidth = 0.4),
legend.position = "top",
legend.title = element_text(size = 9, face = "bold"),
legend.text = element_text(size = 8)
) +
guides(colour = guide_legend(nrow = 1, override.aes = list(size = 3)))
plots[[pg]] <- p
print(p) # → PDF device
}
dev.off() # close PDF before printing to screen
for (p in plots) print(p)
cat("Saved:", pdf_path, "(", n_pages, "page(s),", n_sig, "proteins)\n")
invisible(pdf_path)
}contrasts_all <- sort(unique(de_sig$Label))
for (ct in contrasts_all) make_profiles(ct)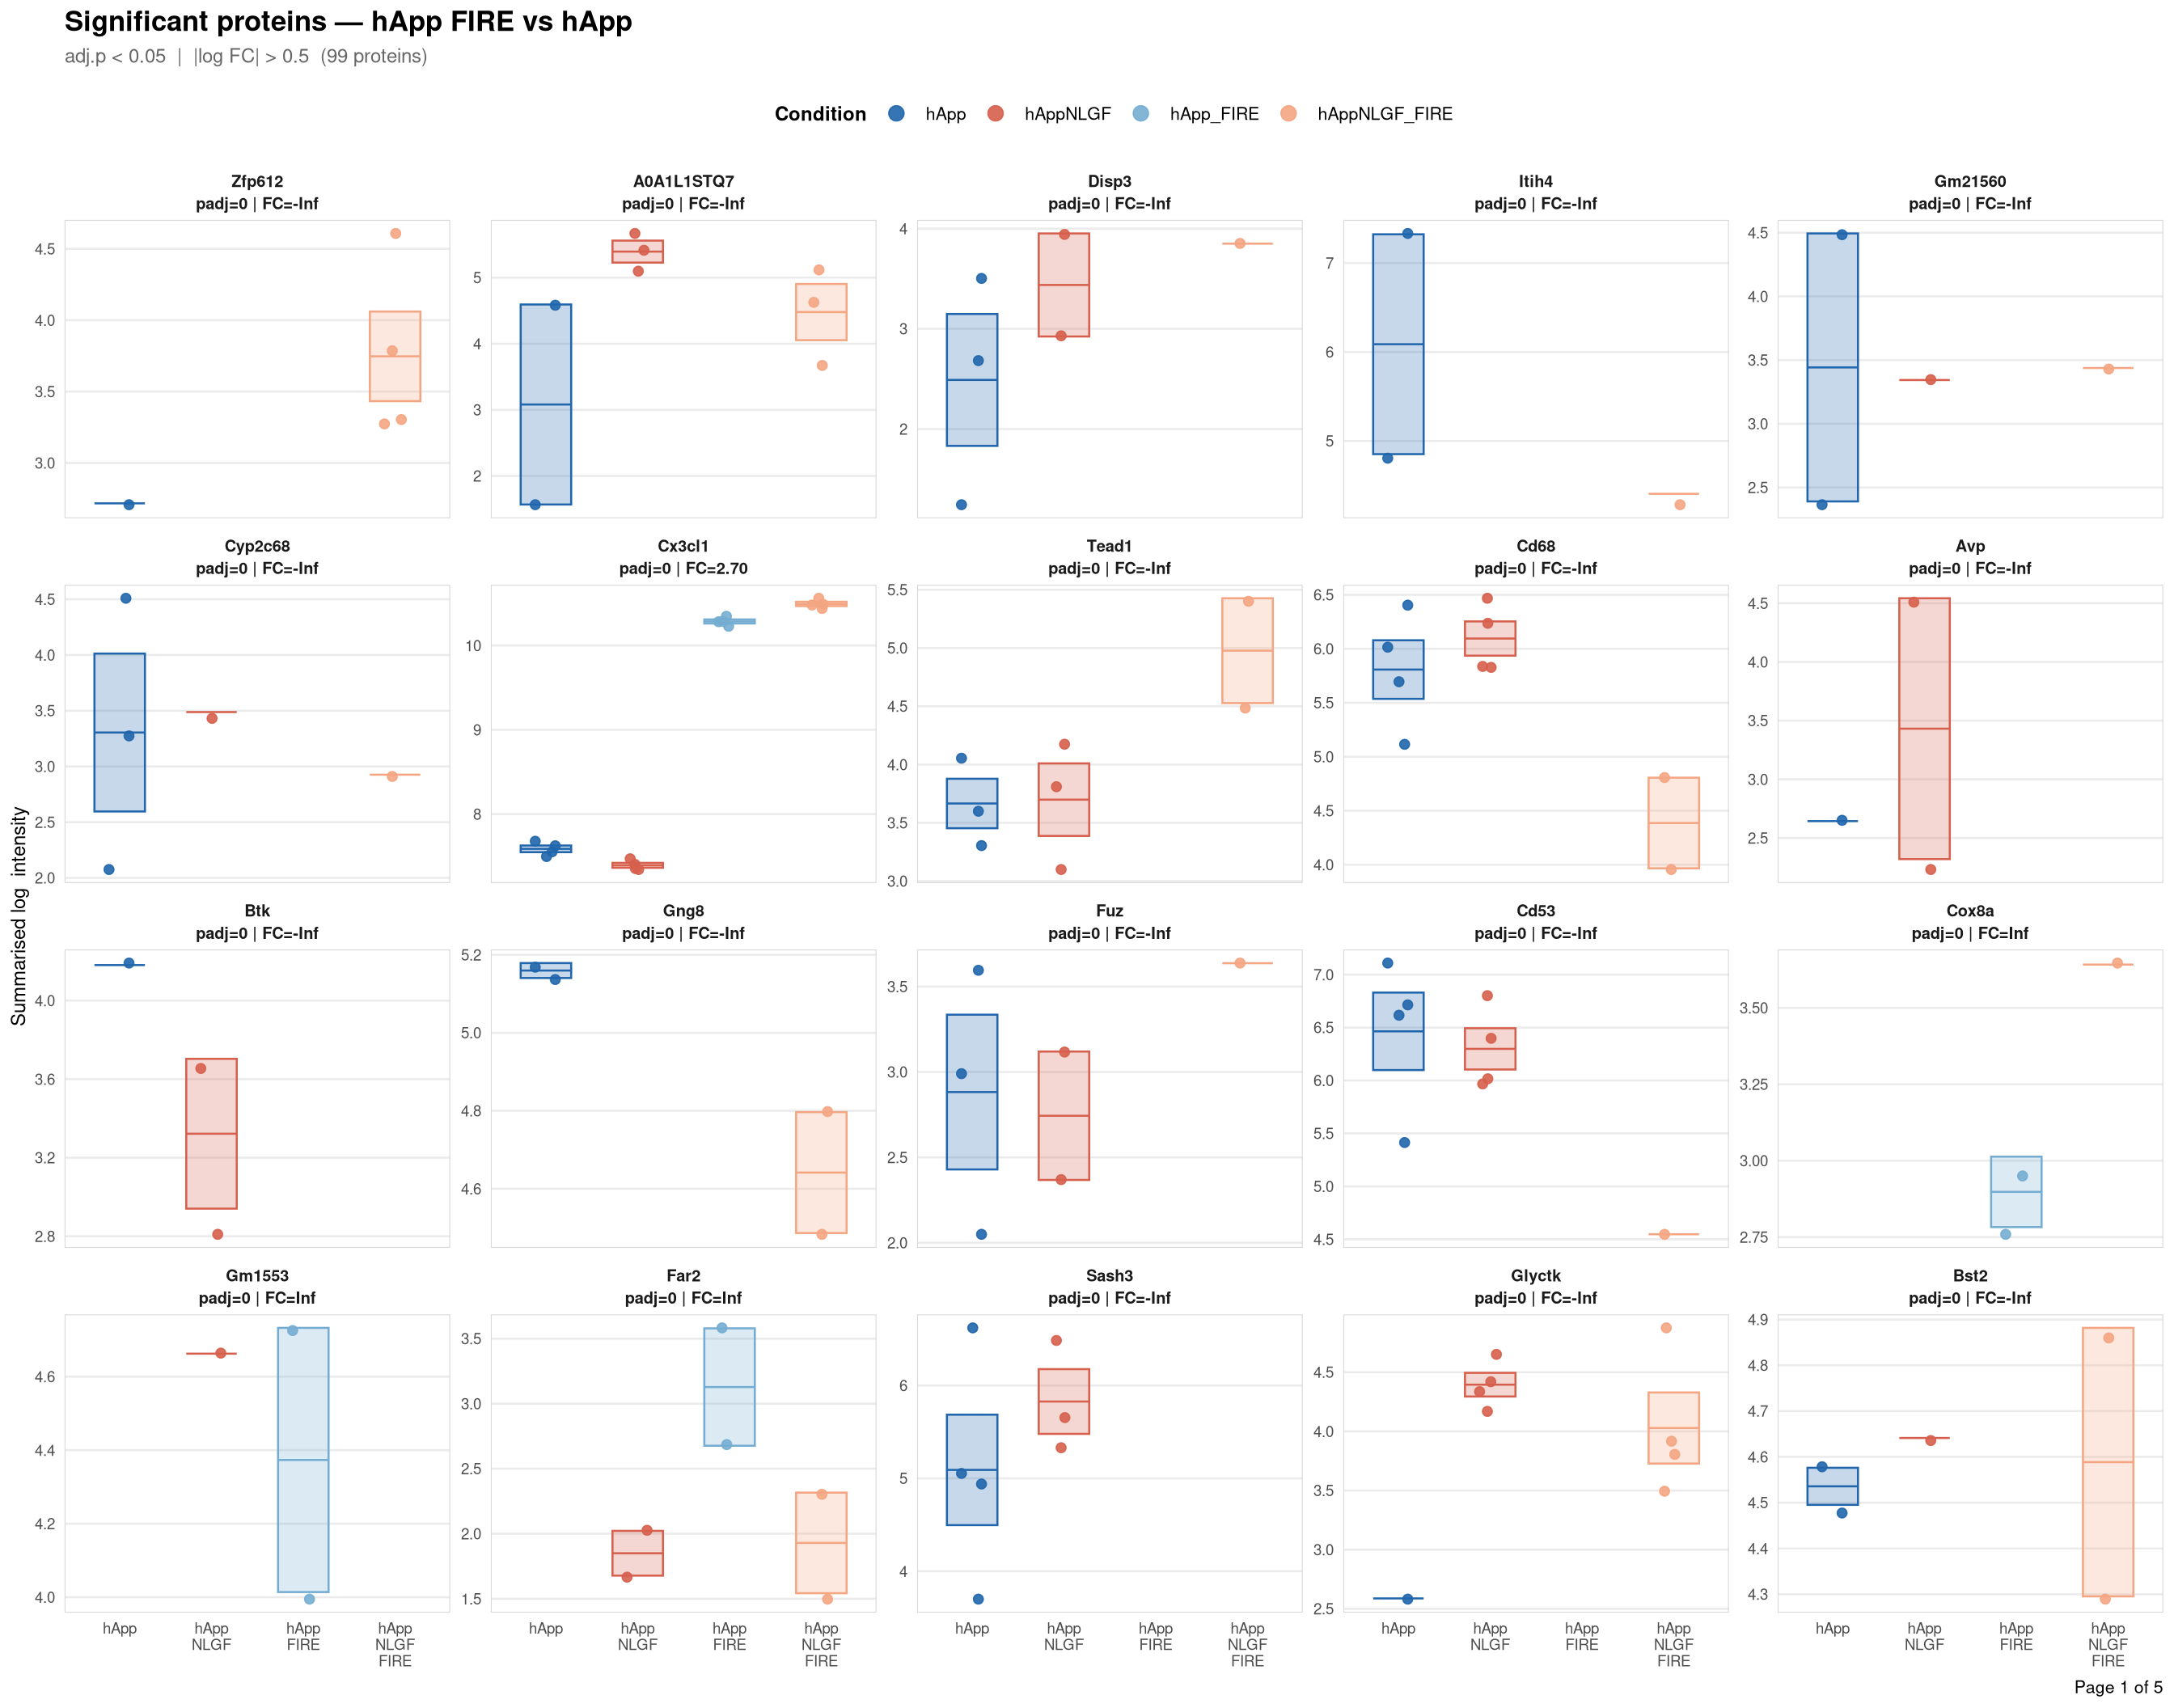
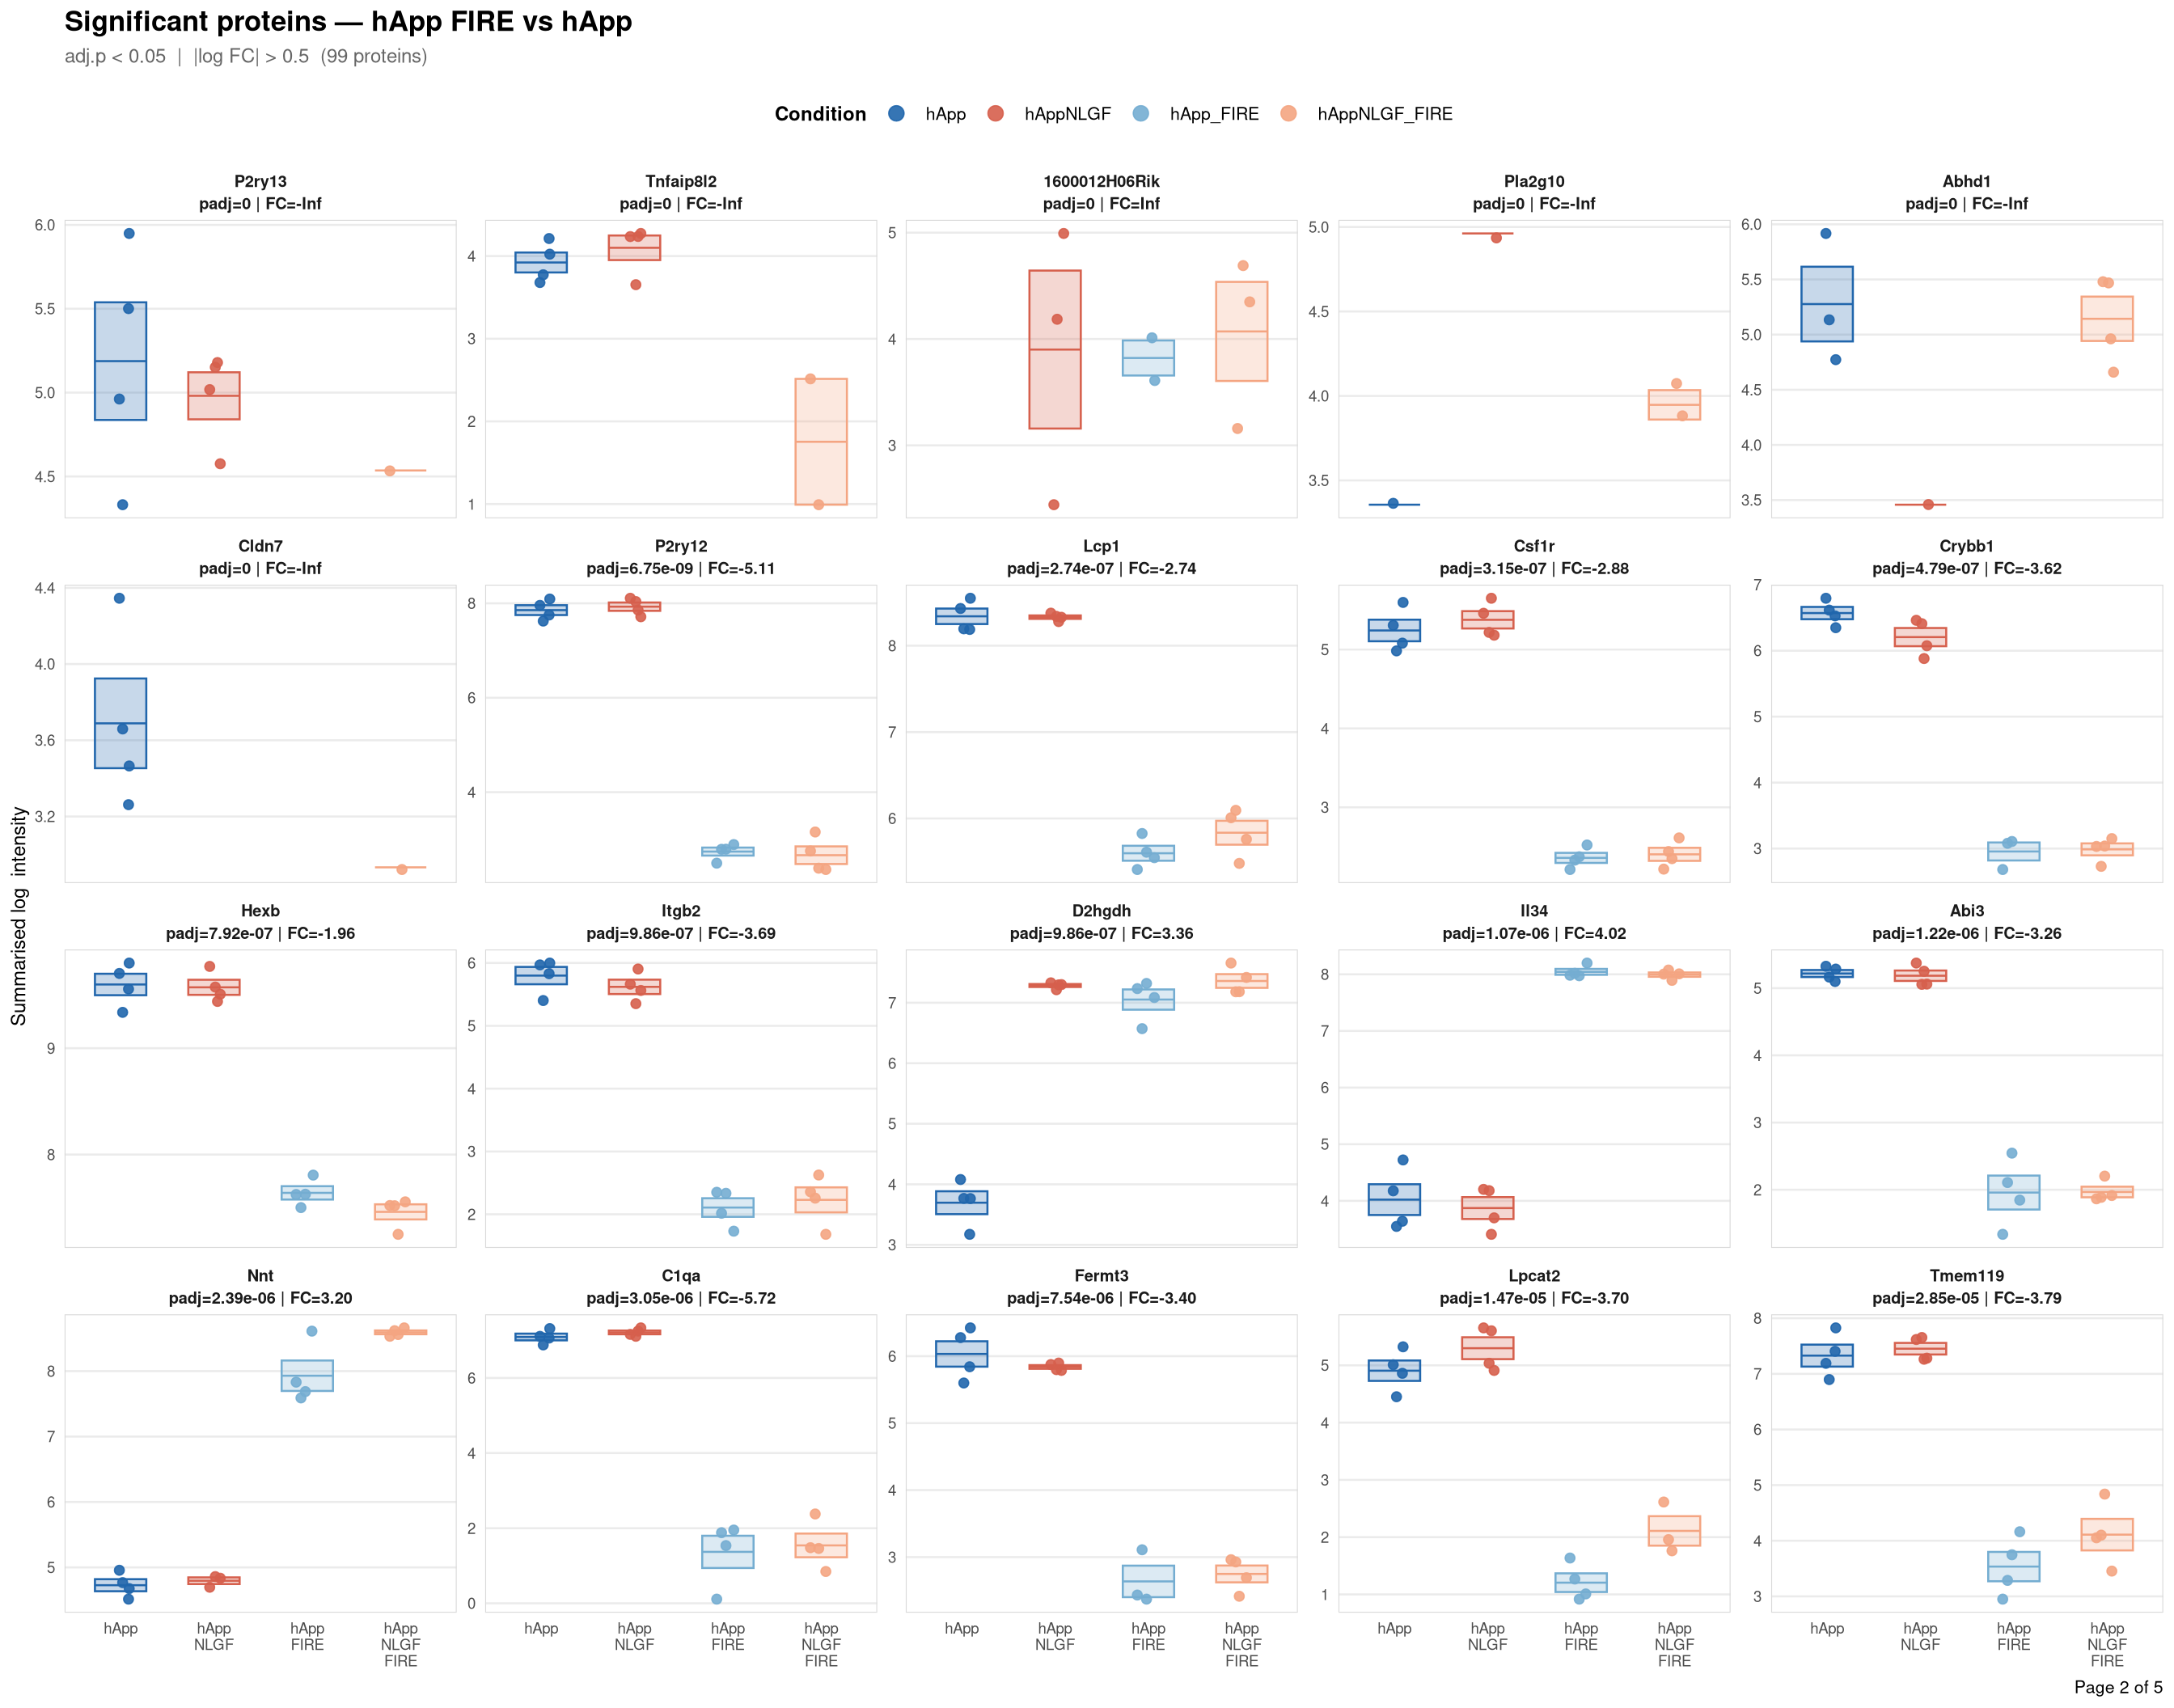
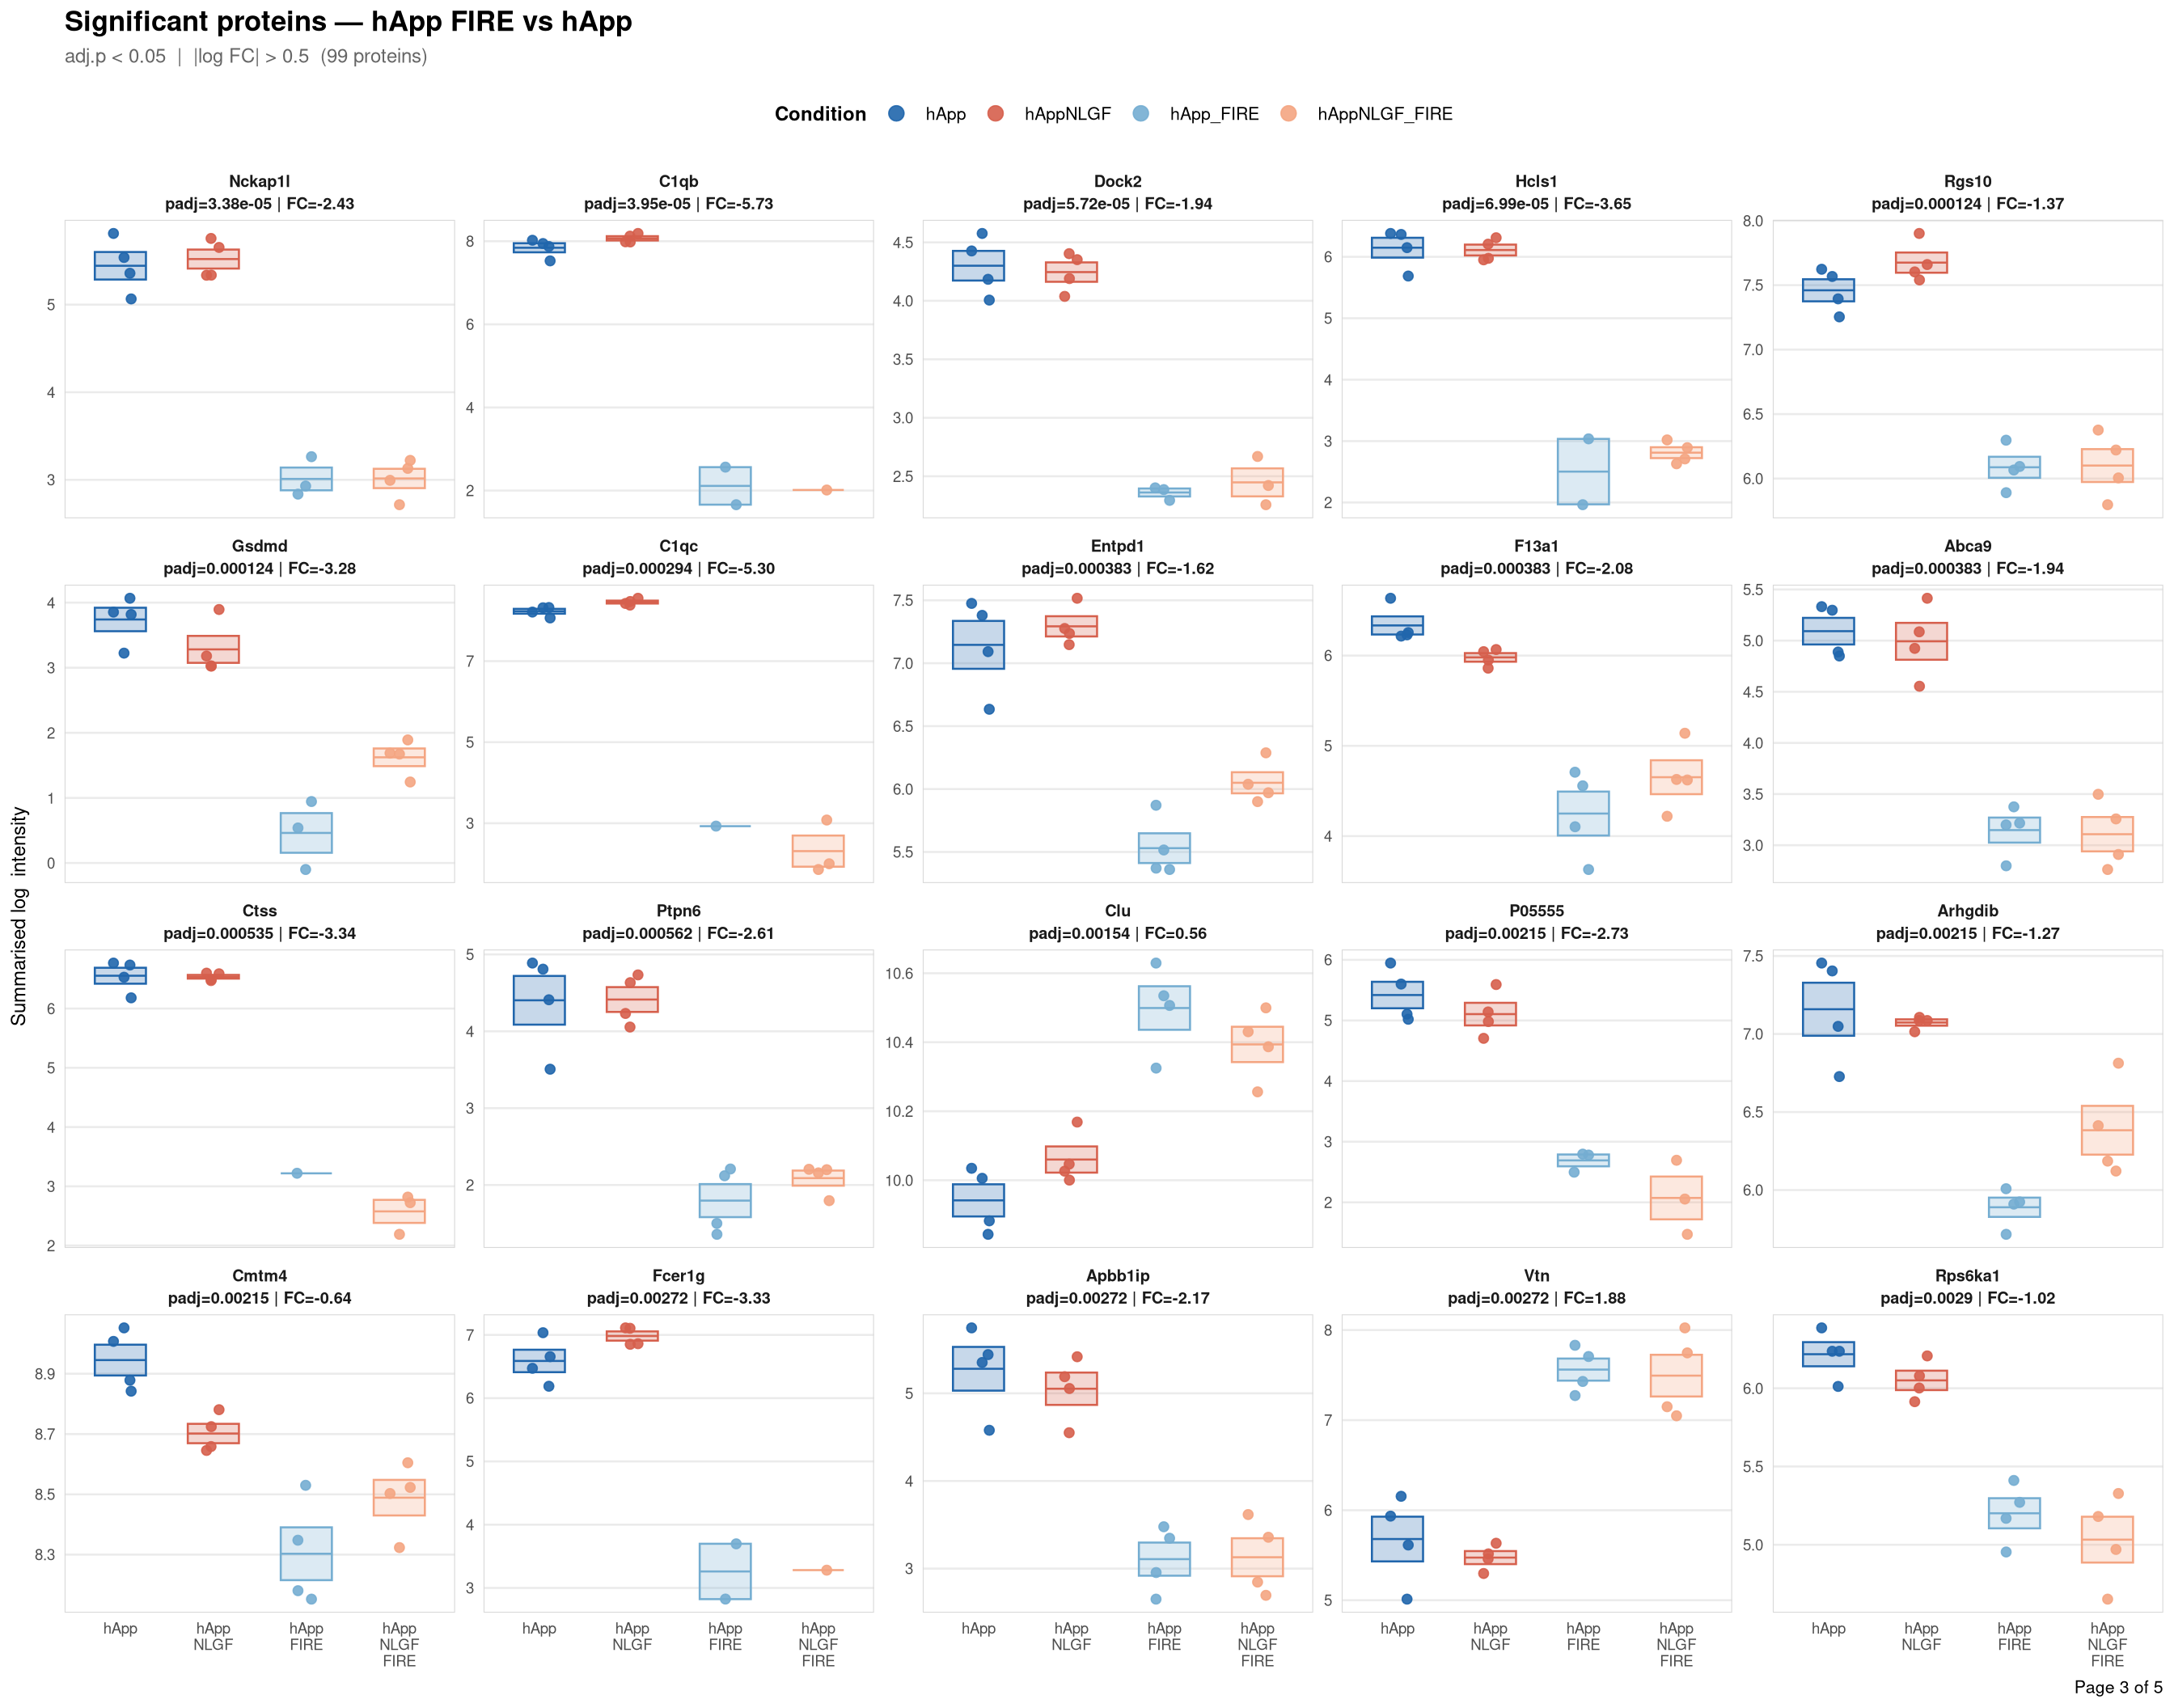
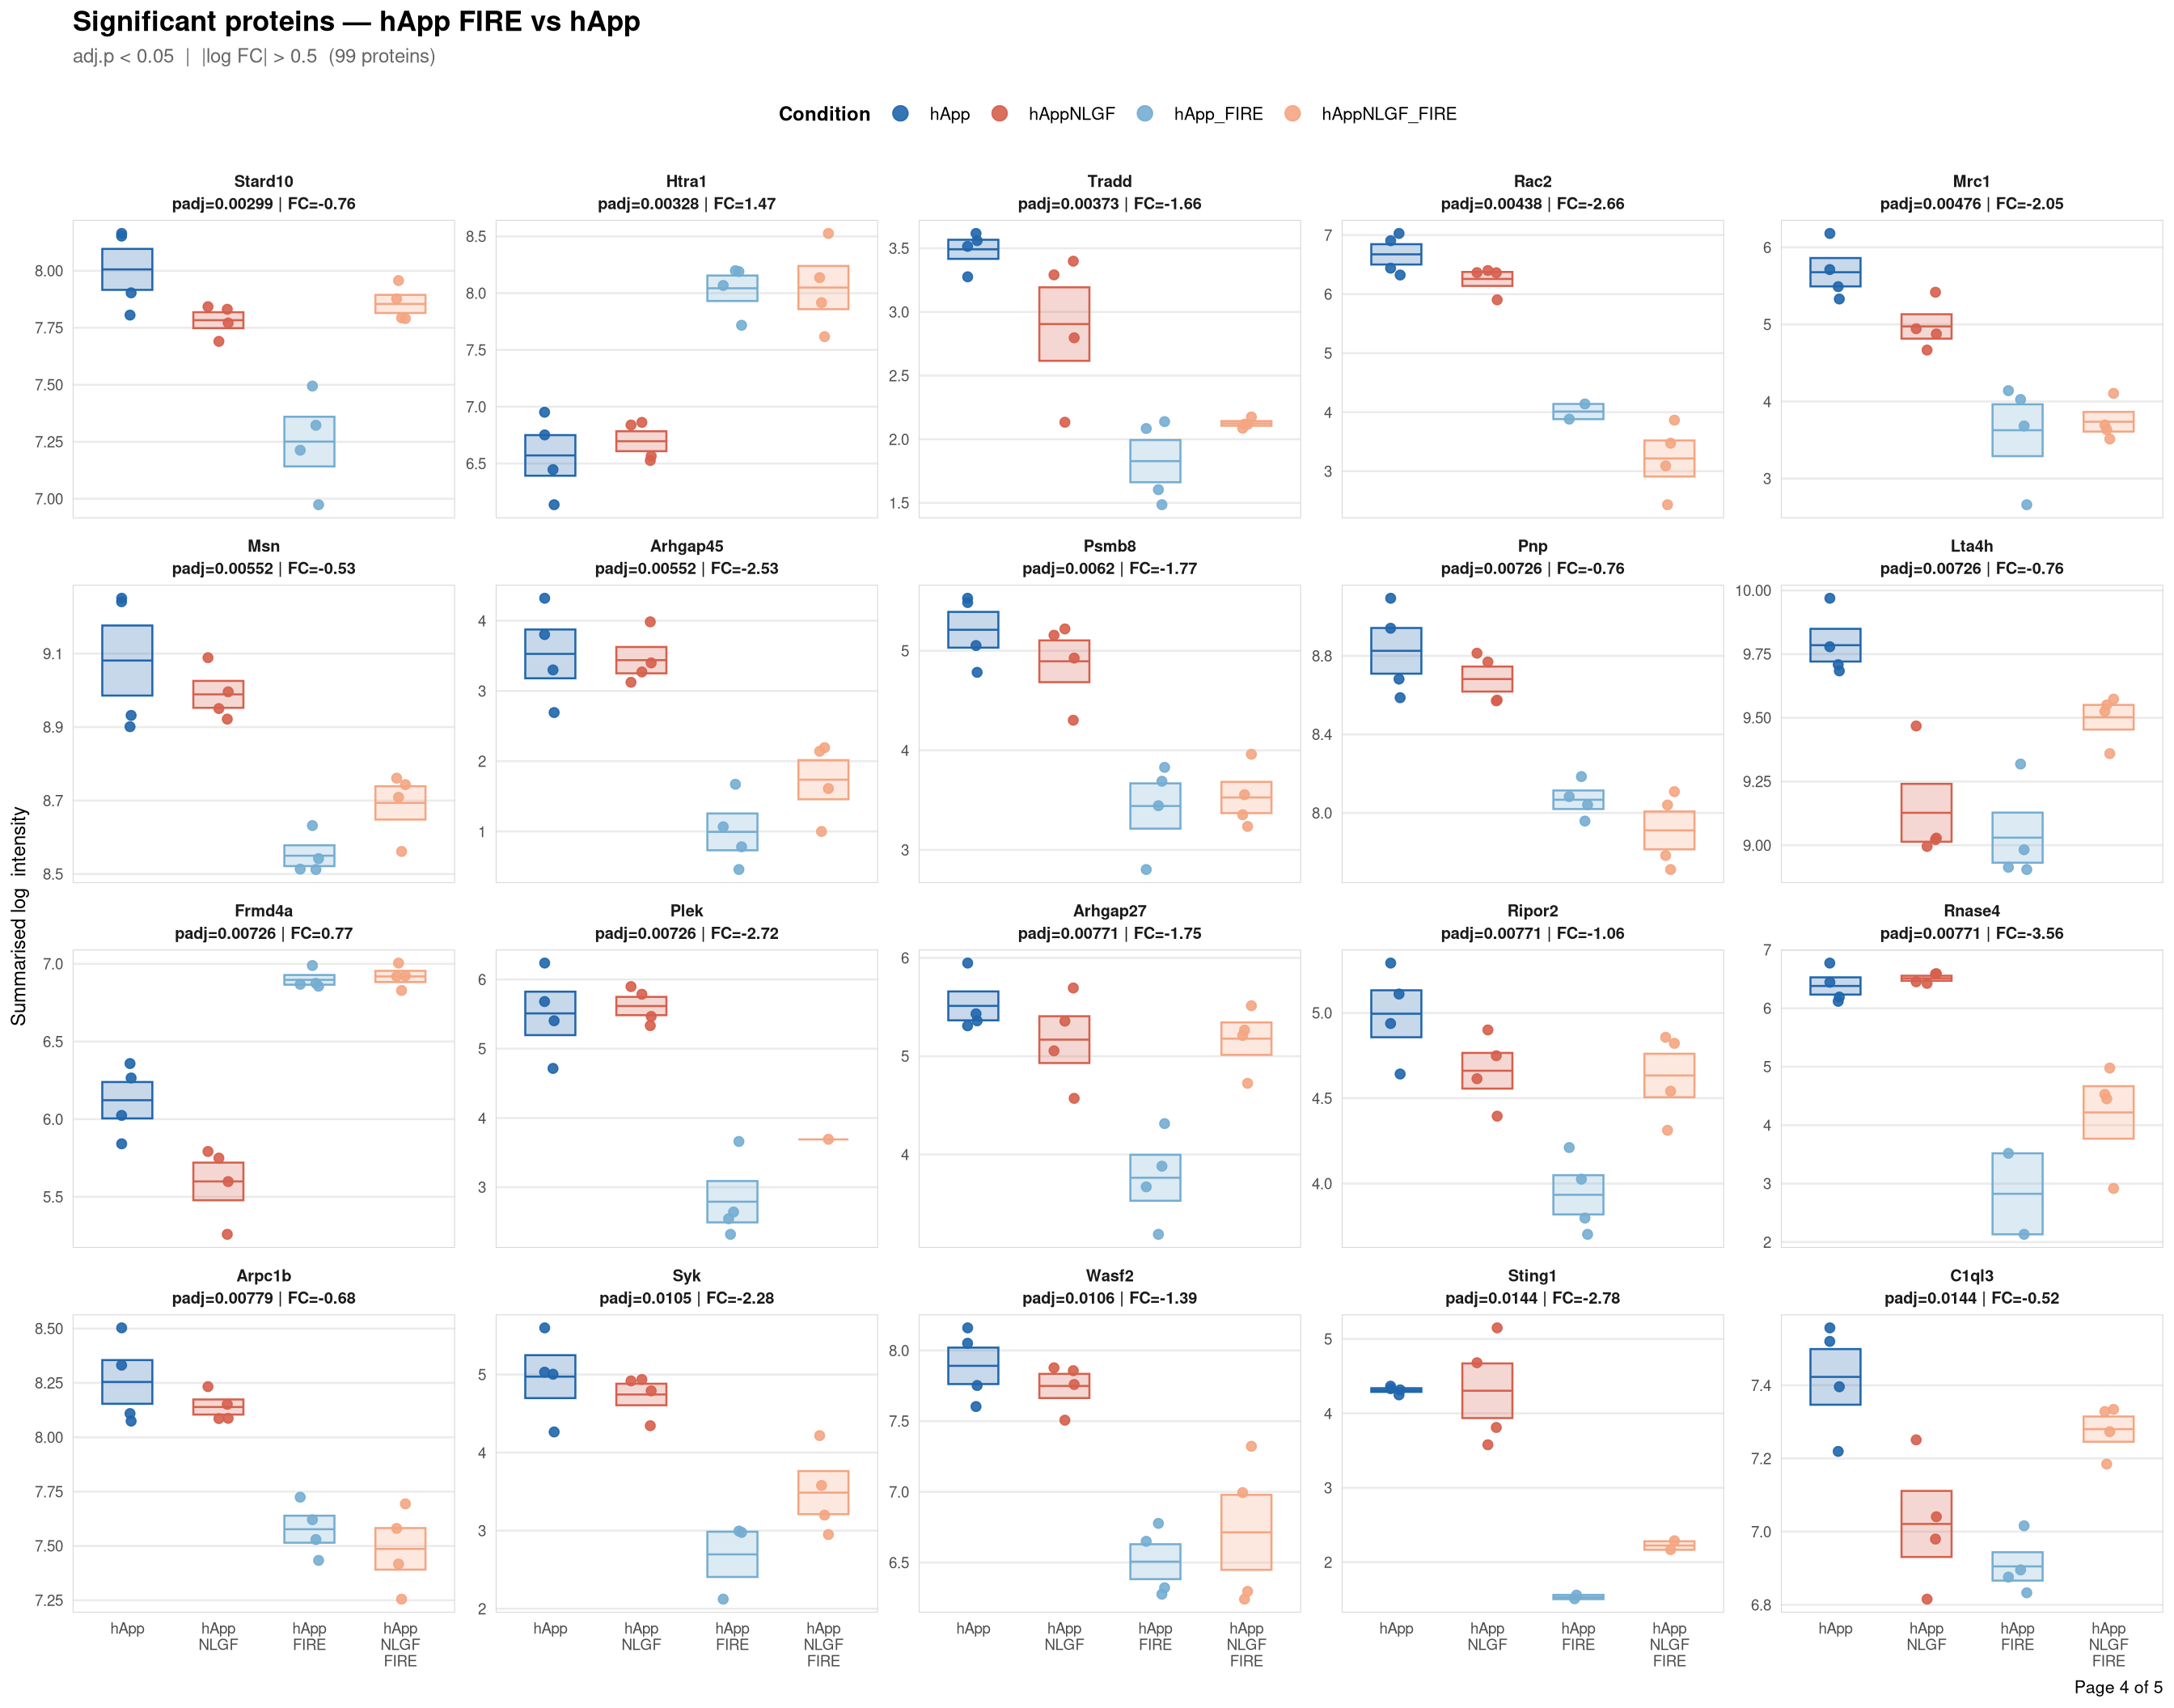
Saved: /nemo/lab/destrooperb/home/shared/zanettc/giulia_proteomics/bulk_proteomics/results/run4/ProteinProfiles_hApp_FIRE_vs_hApp.pdf ( 5 page(s), 99 proteins)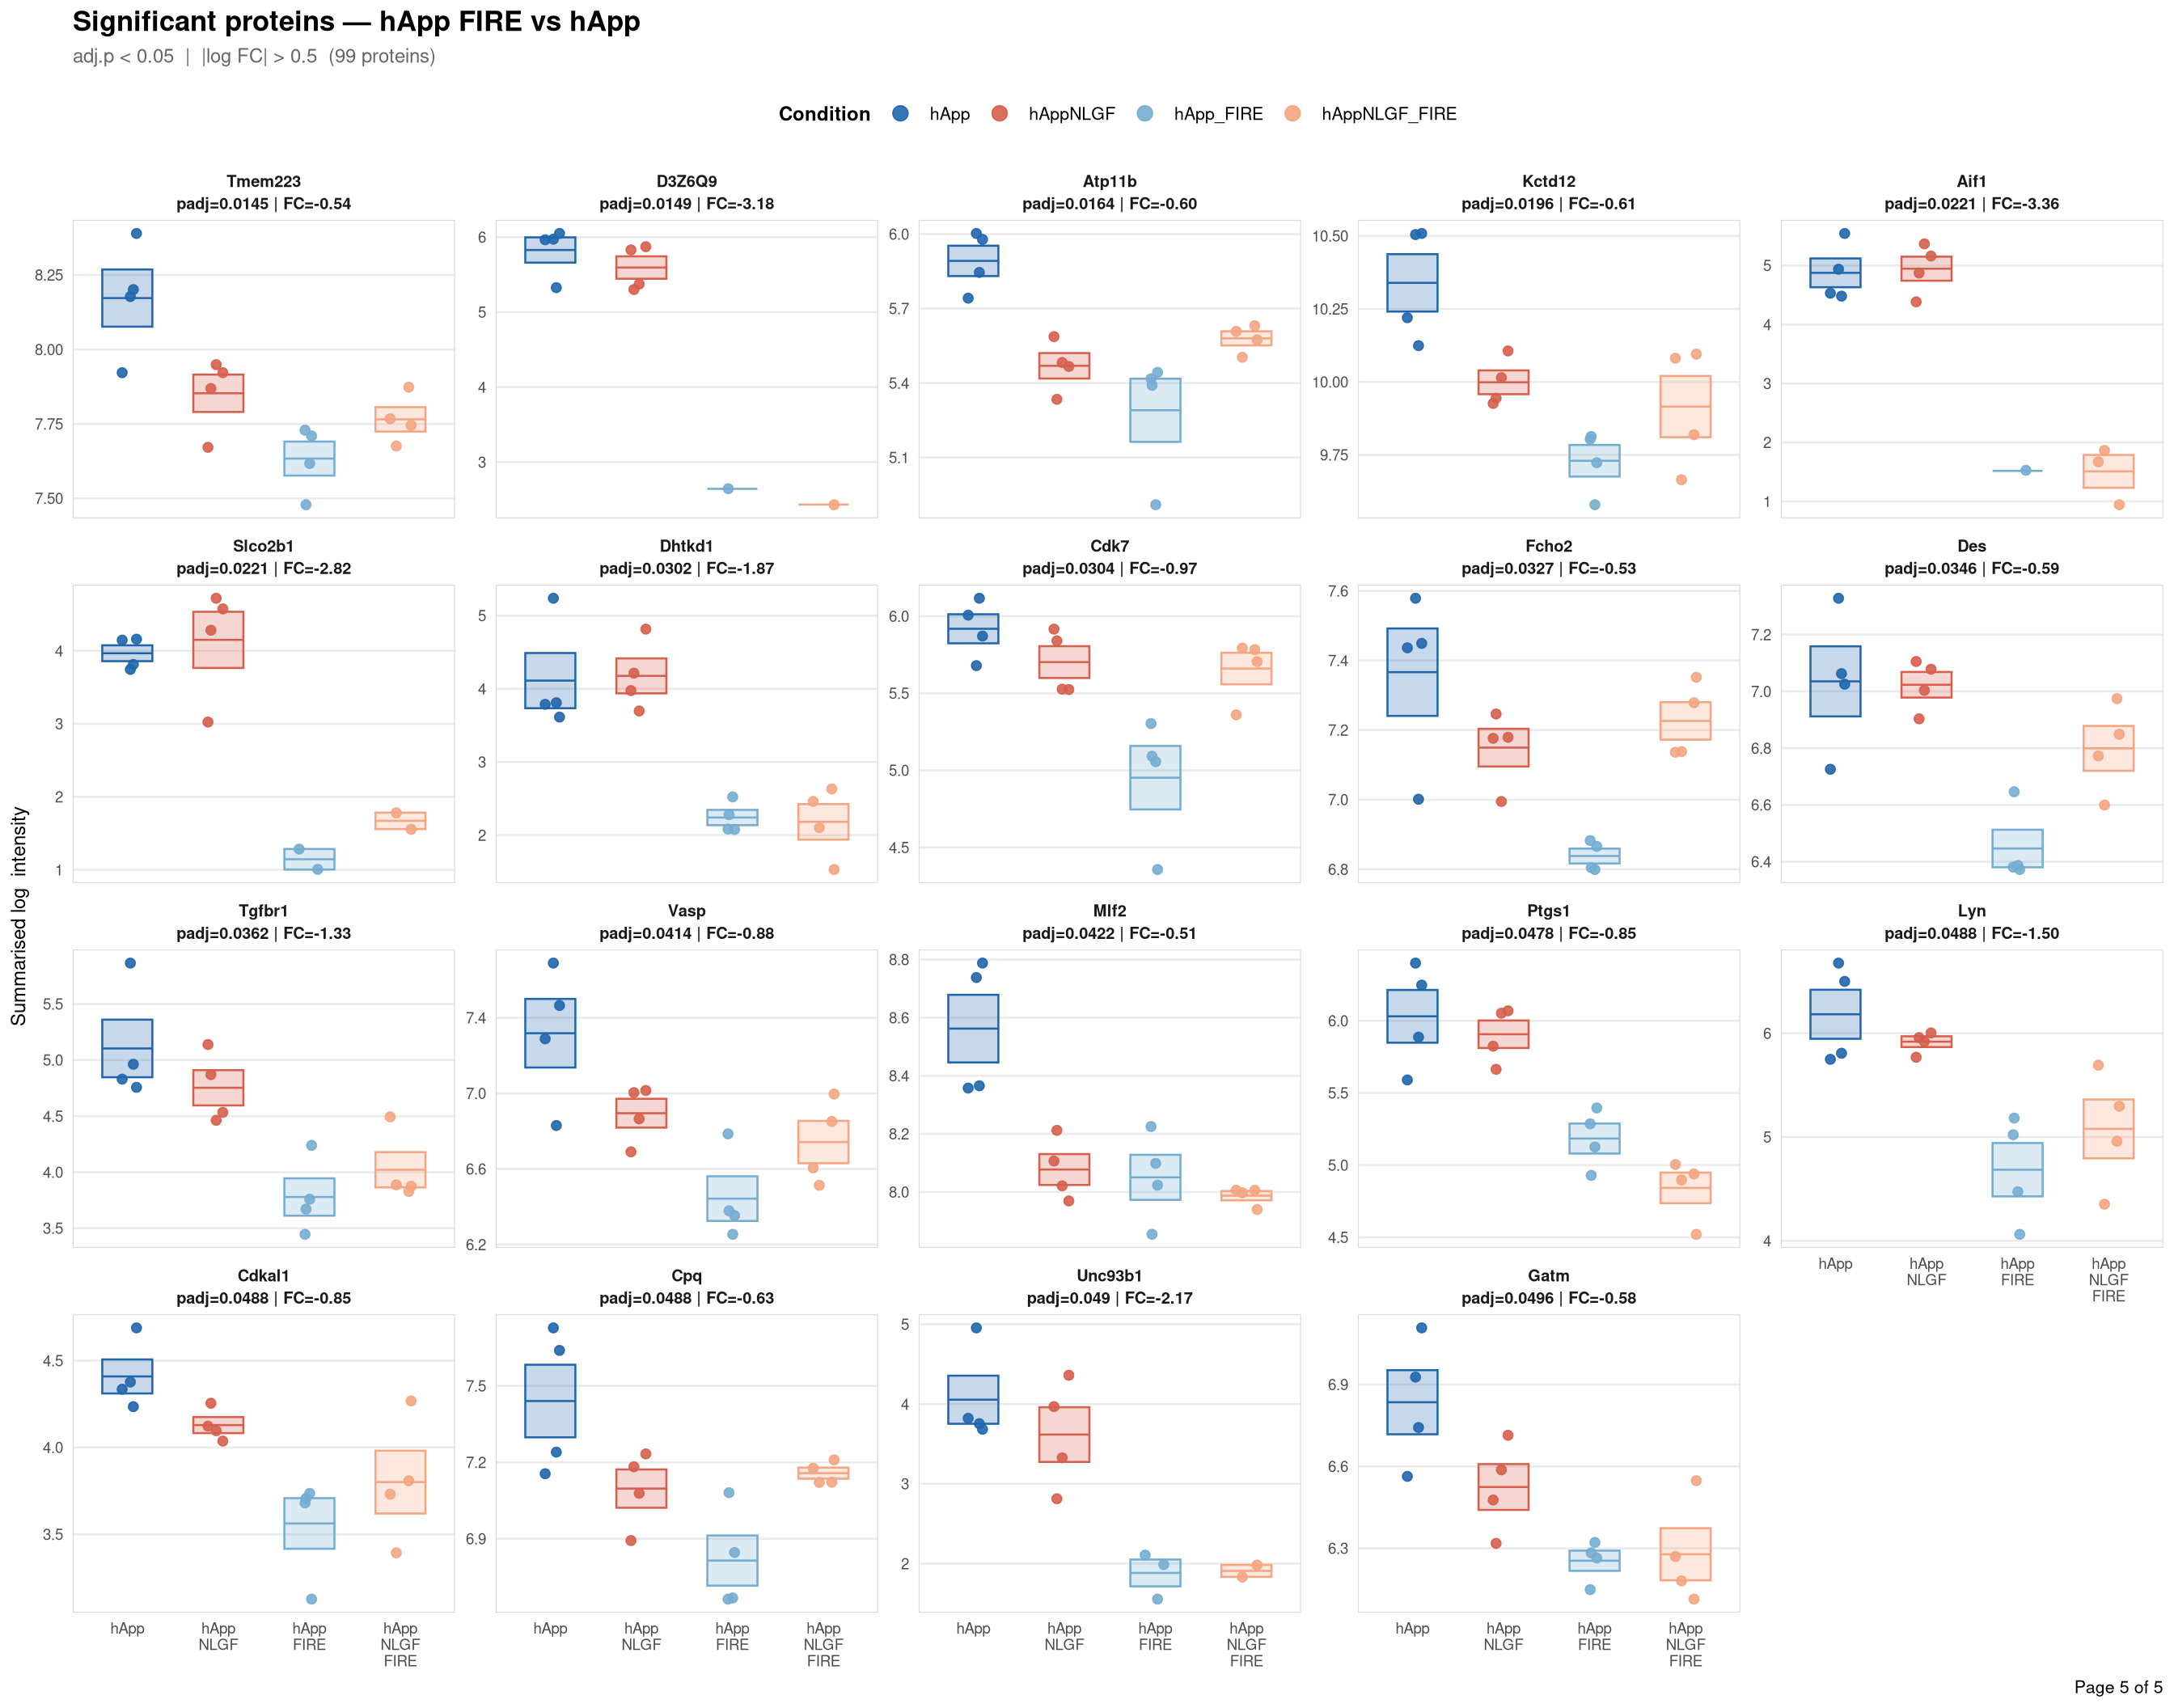
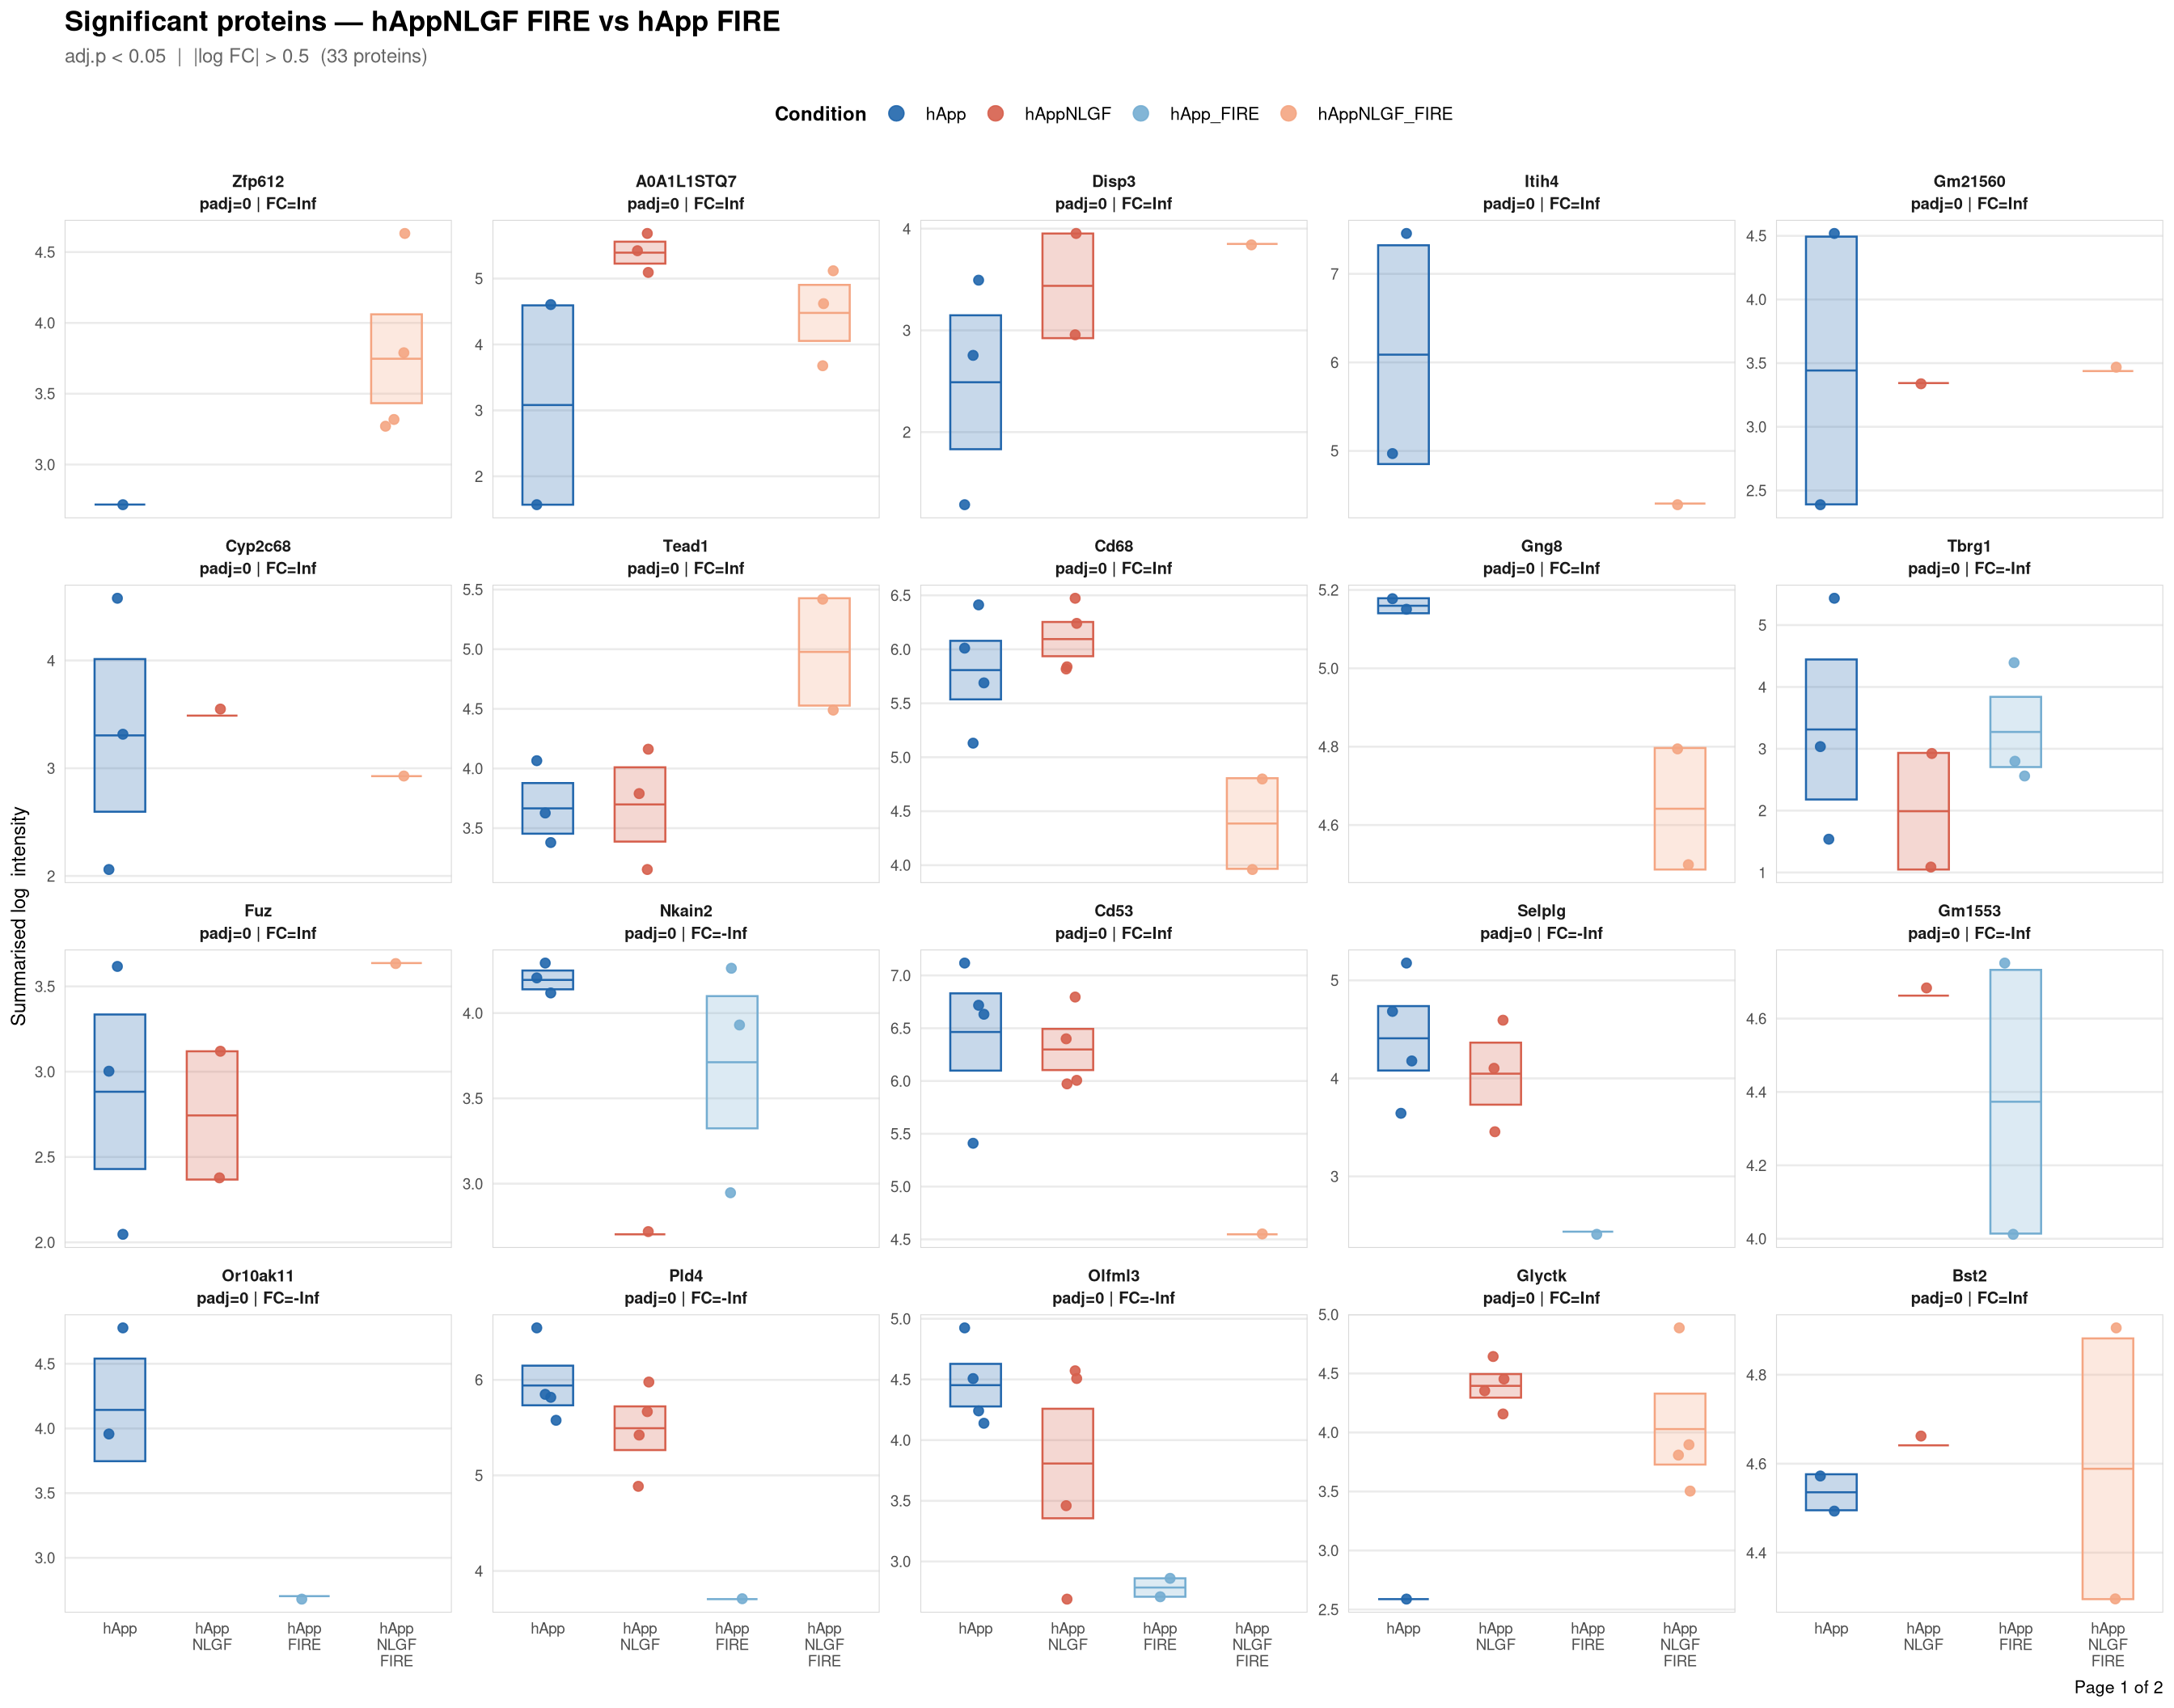
Saved: /nemo/lab/destrooperb/home/shared/zanettc/giulia_proteomics/bulk_proteomics/results/run4/ProteinProfiles_hAppNLGF_FIRE_vs_hApp_FIRE.pdf ( 2 page(s), 33 proteins)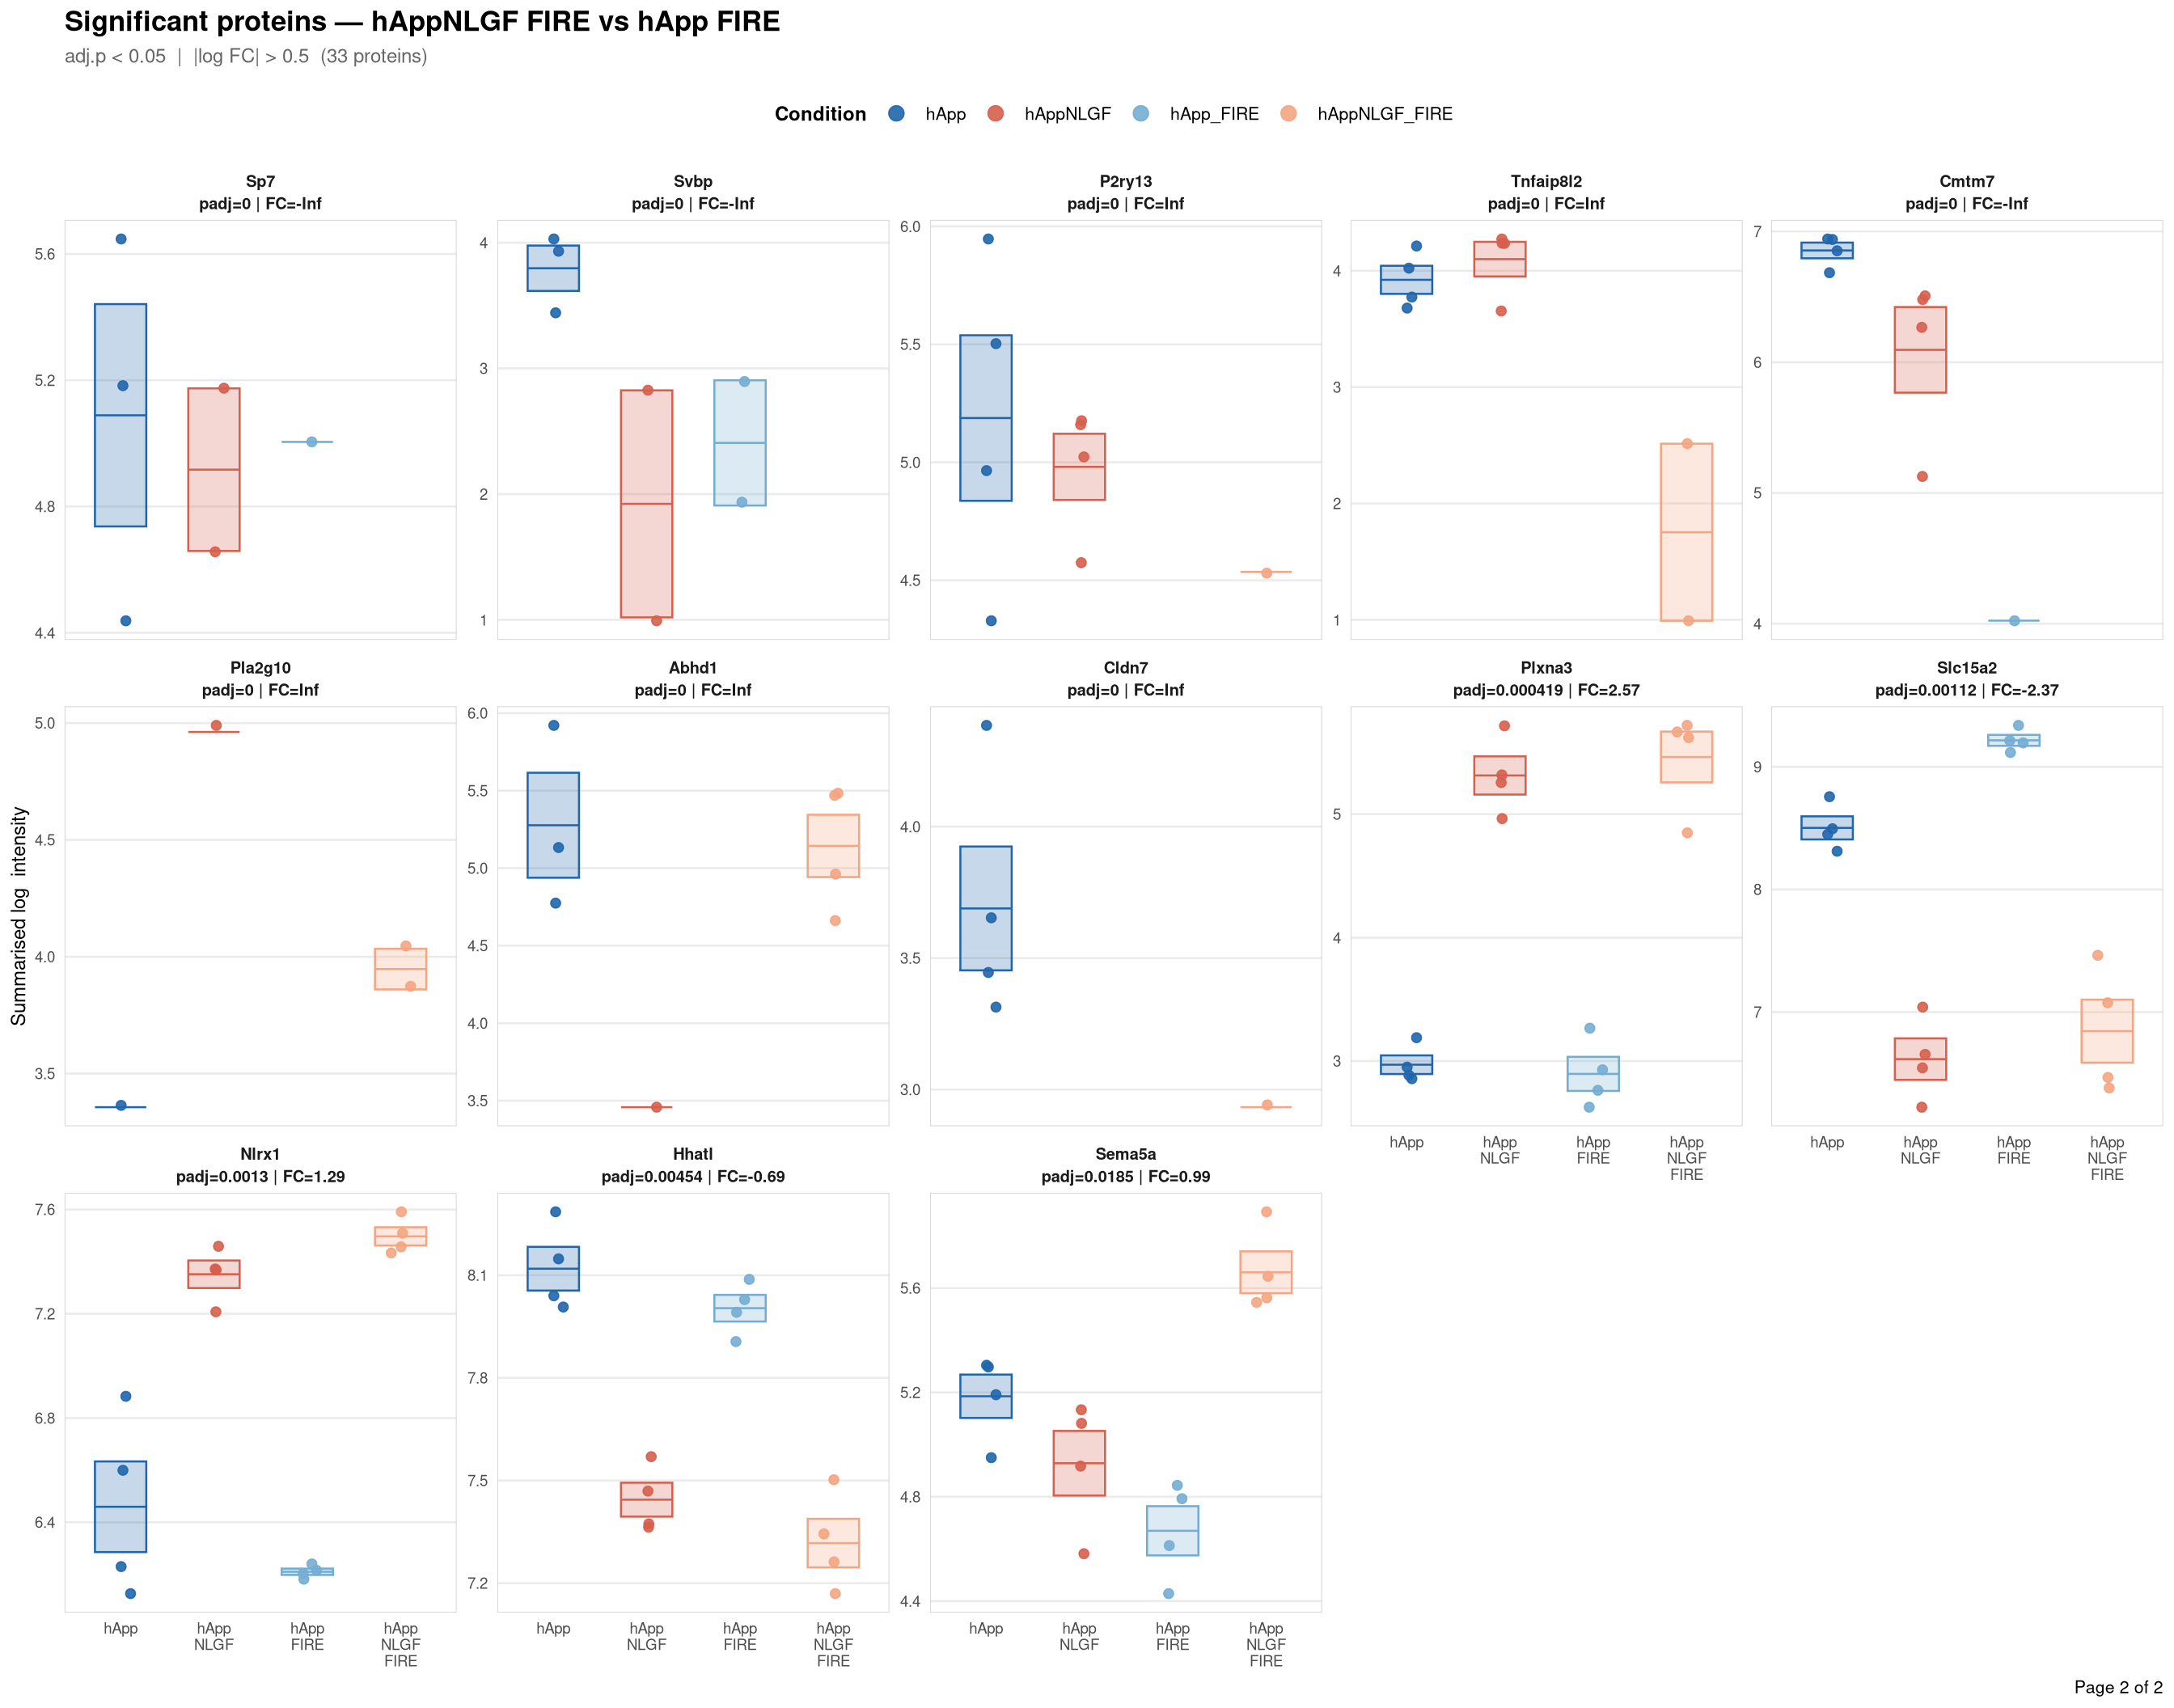
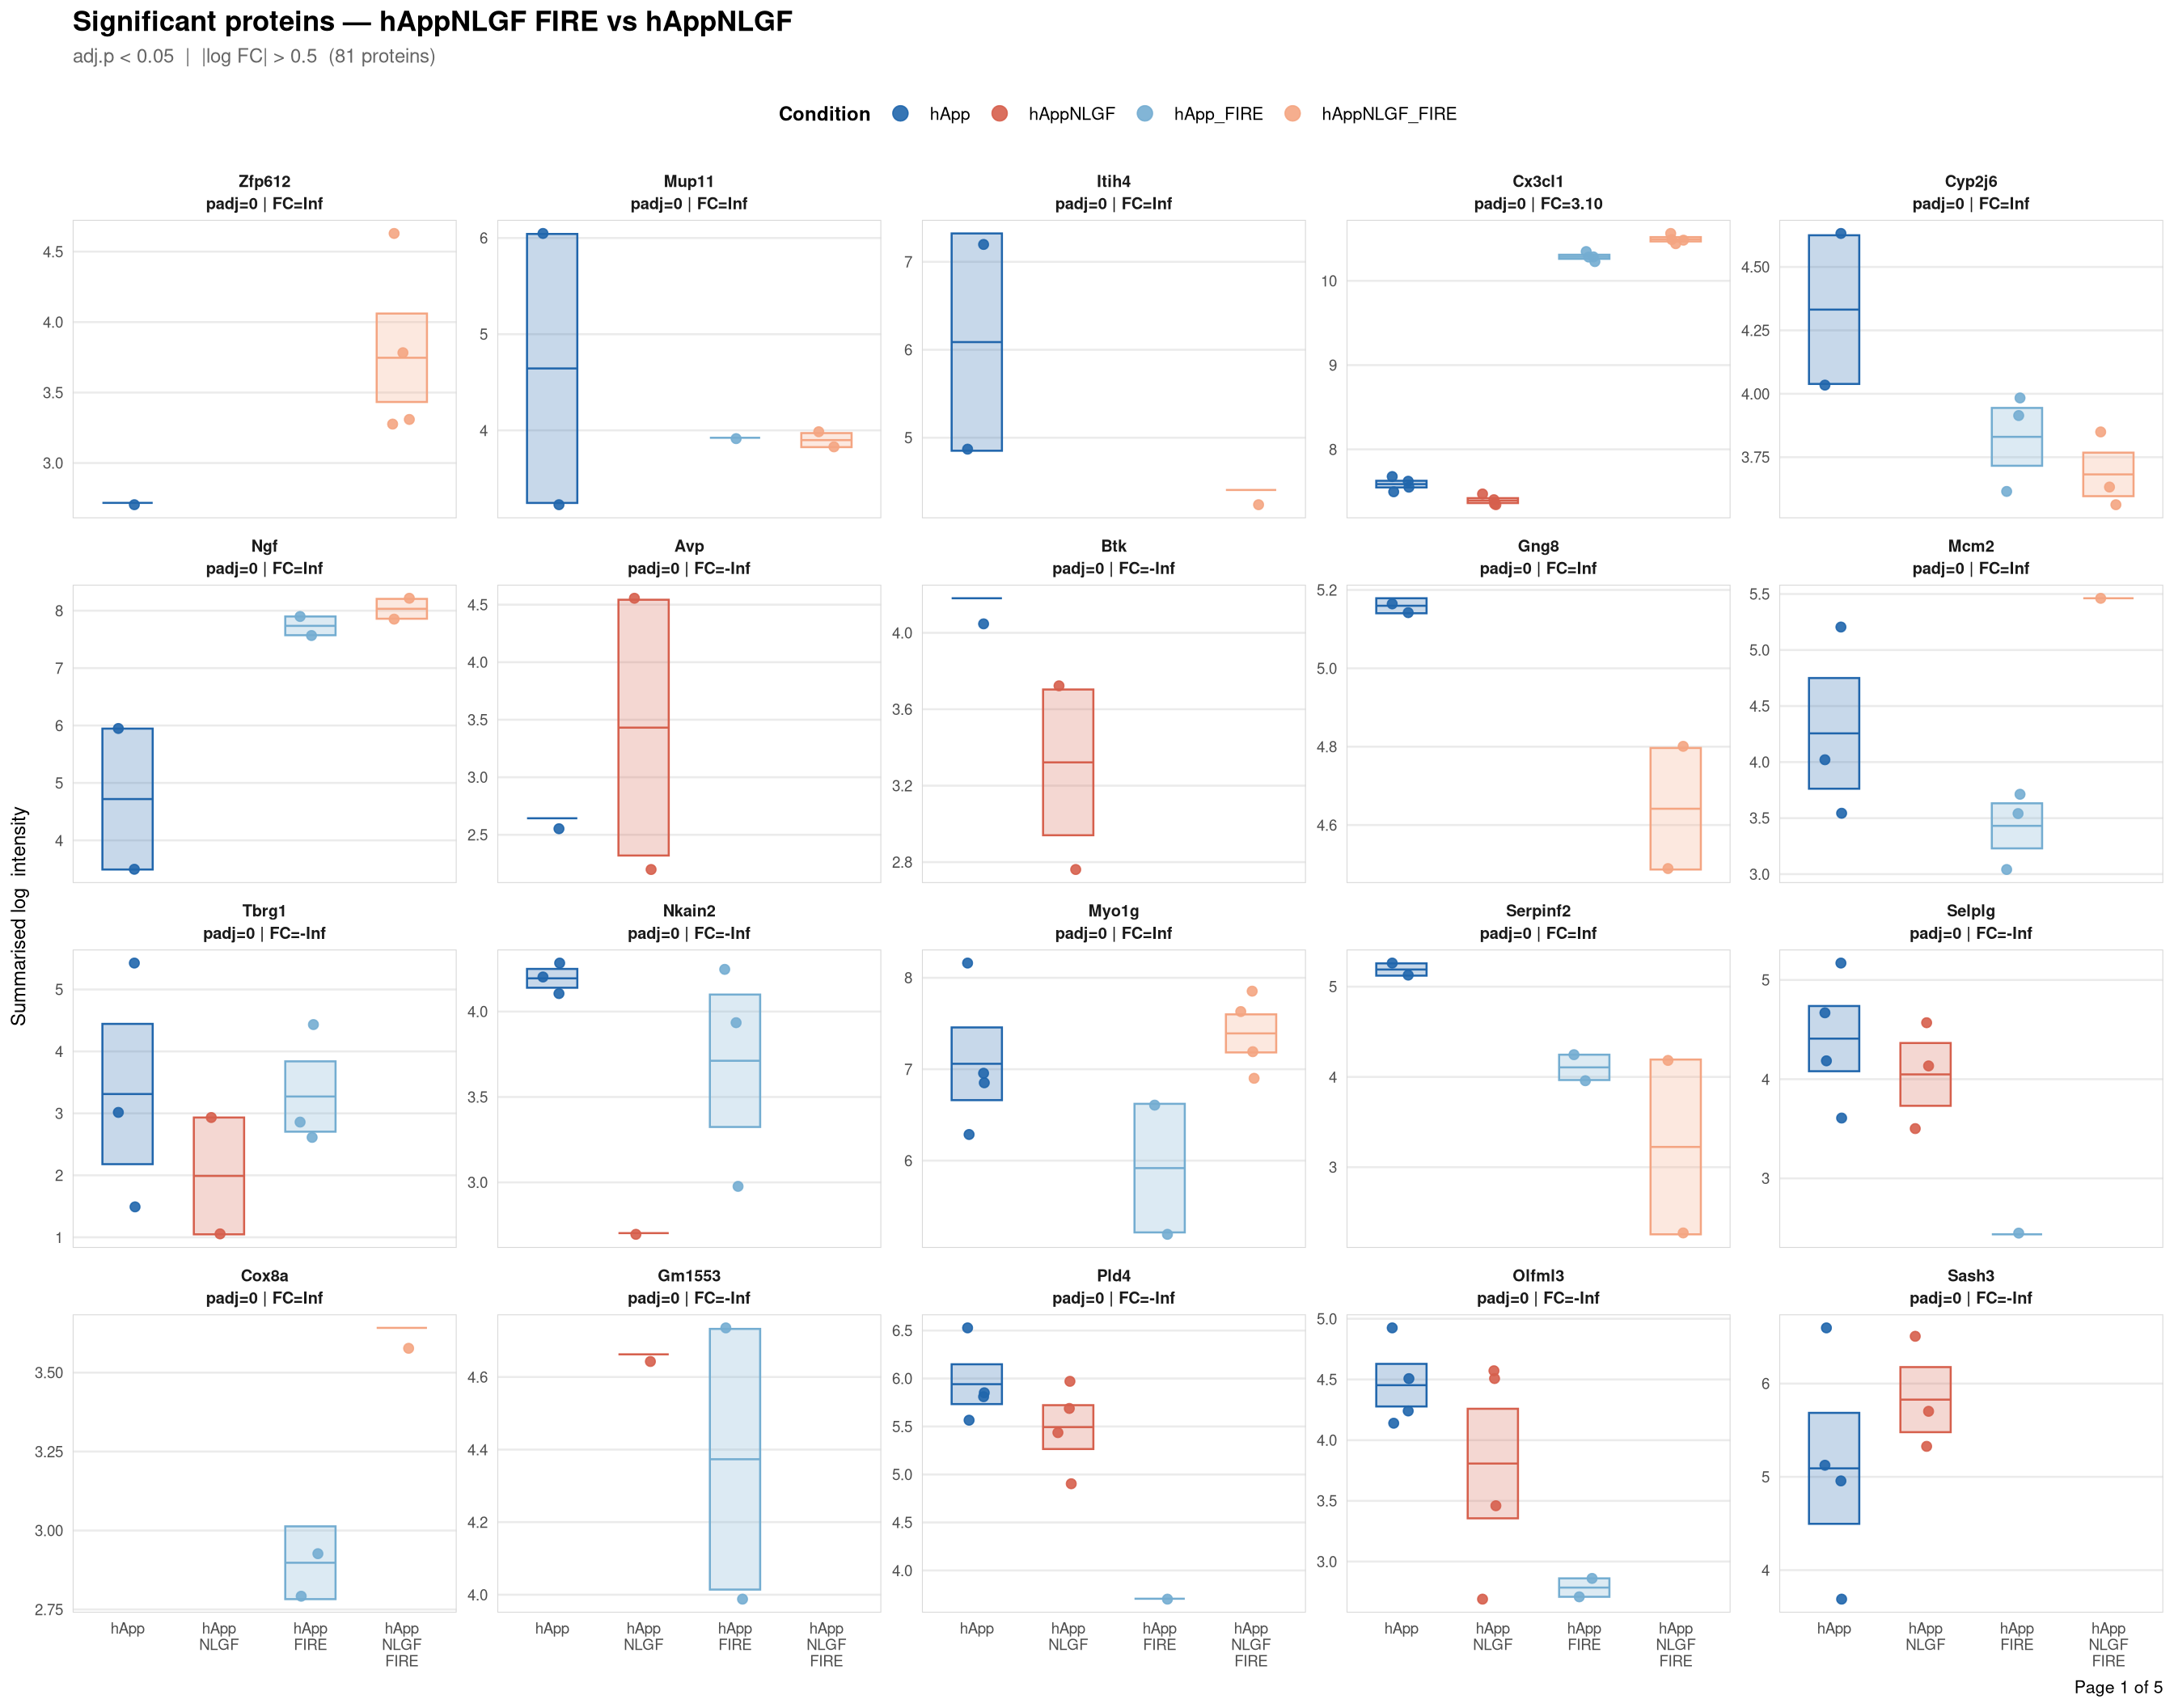
Saved: /nemo/lab/destrooperb/home/shared/zanettc/giulia_proteomics/bulk_proteomics/results/run4/ProteinProfiles_hAppNLGF_FIRE_vs_hAppNLGF.pdf ( 5 page(s), 81 proteins)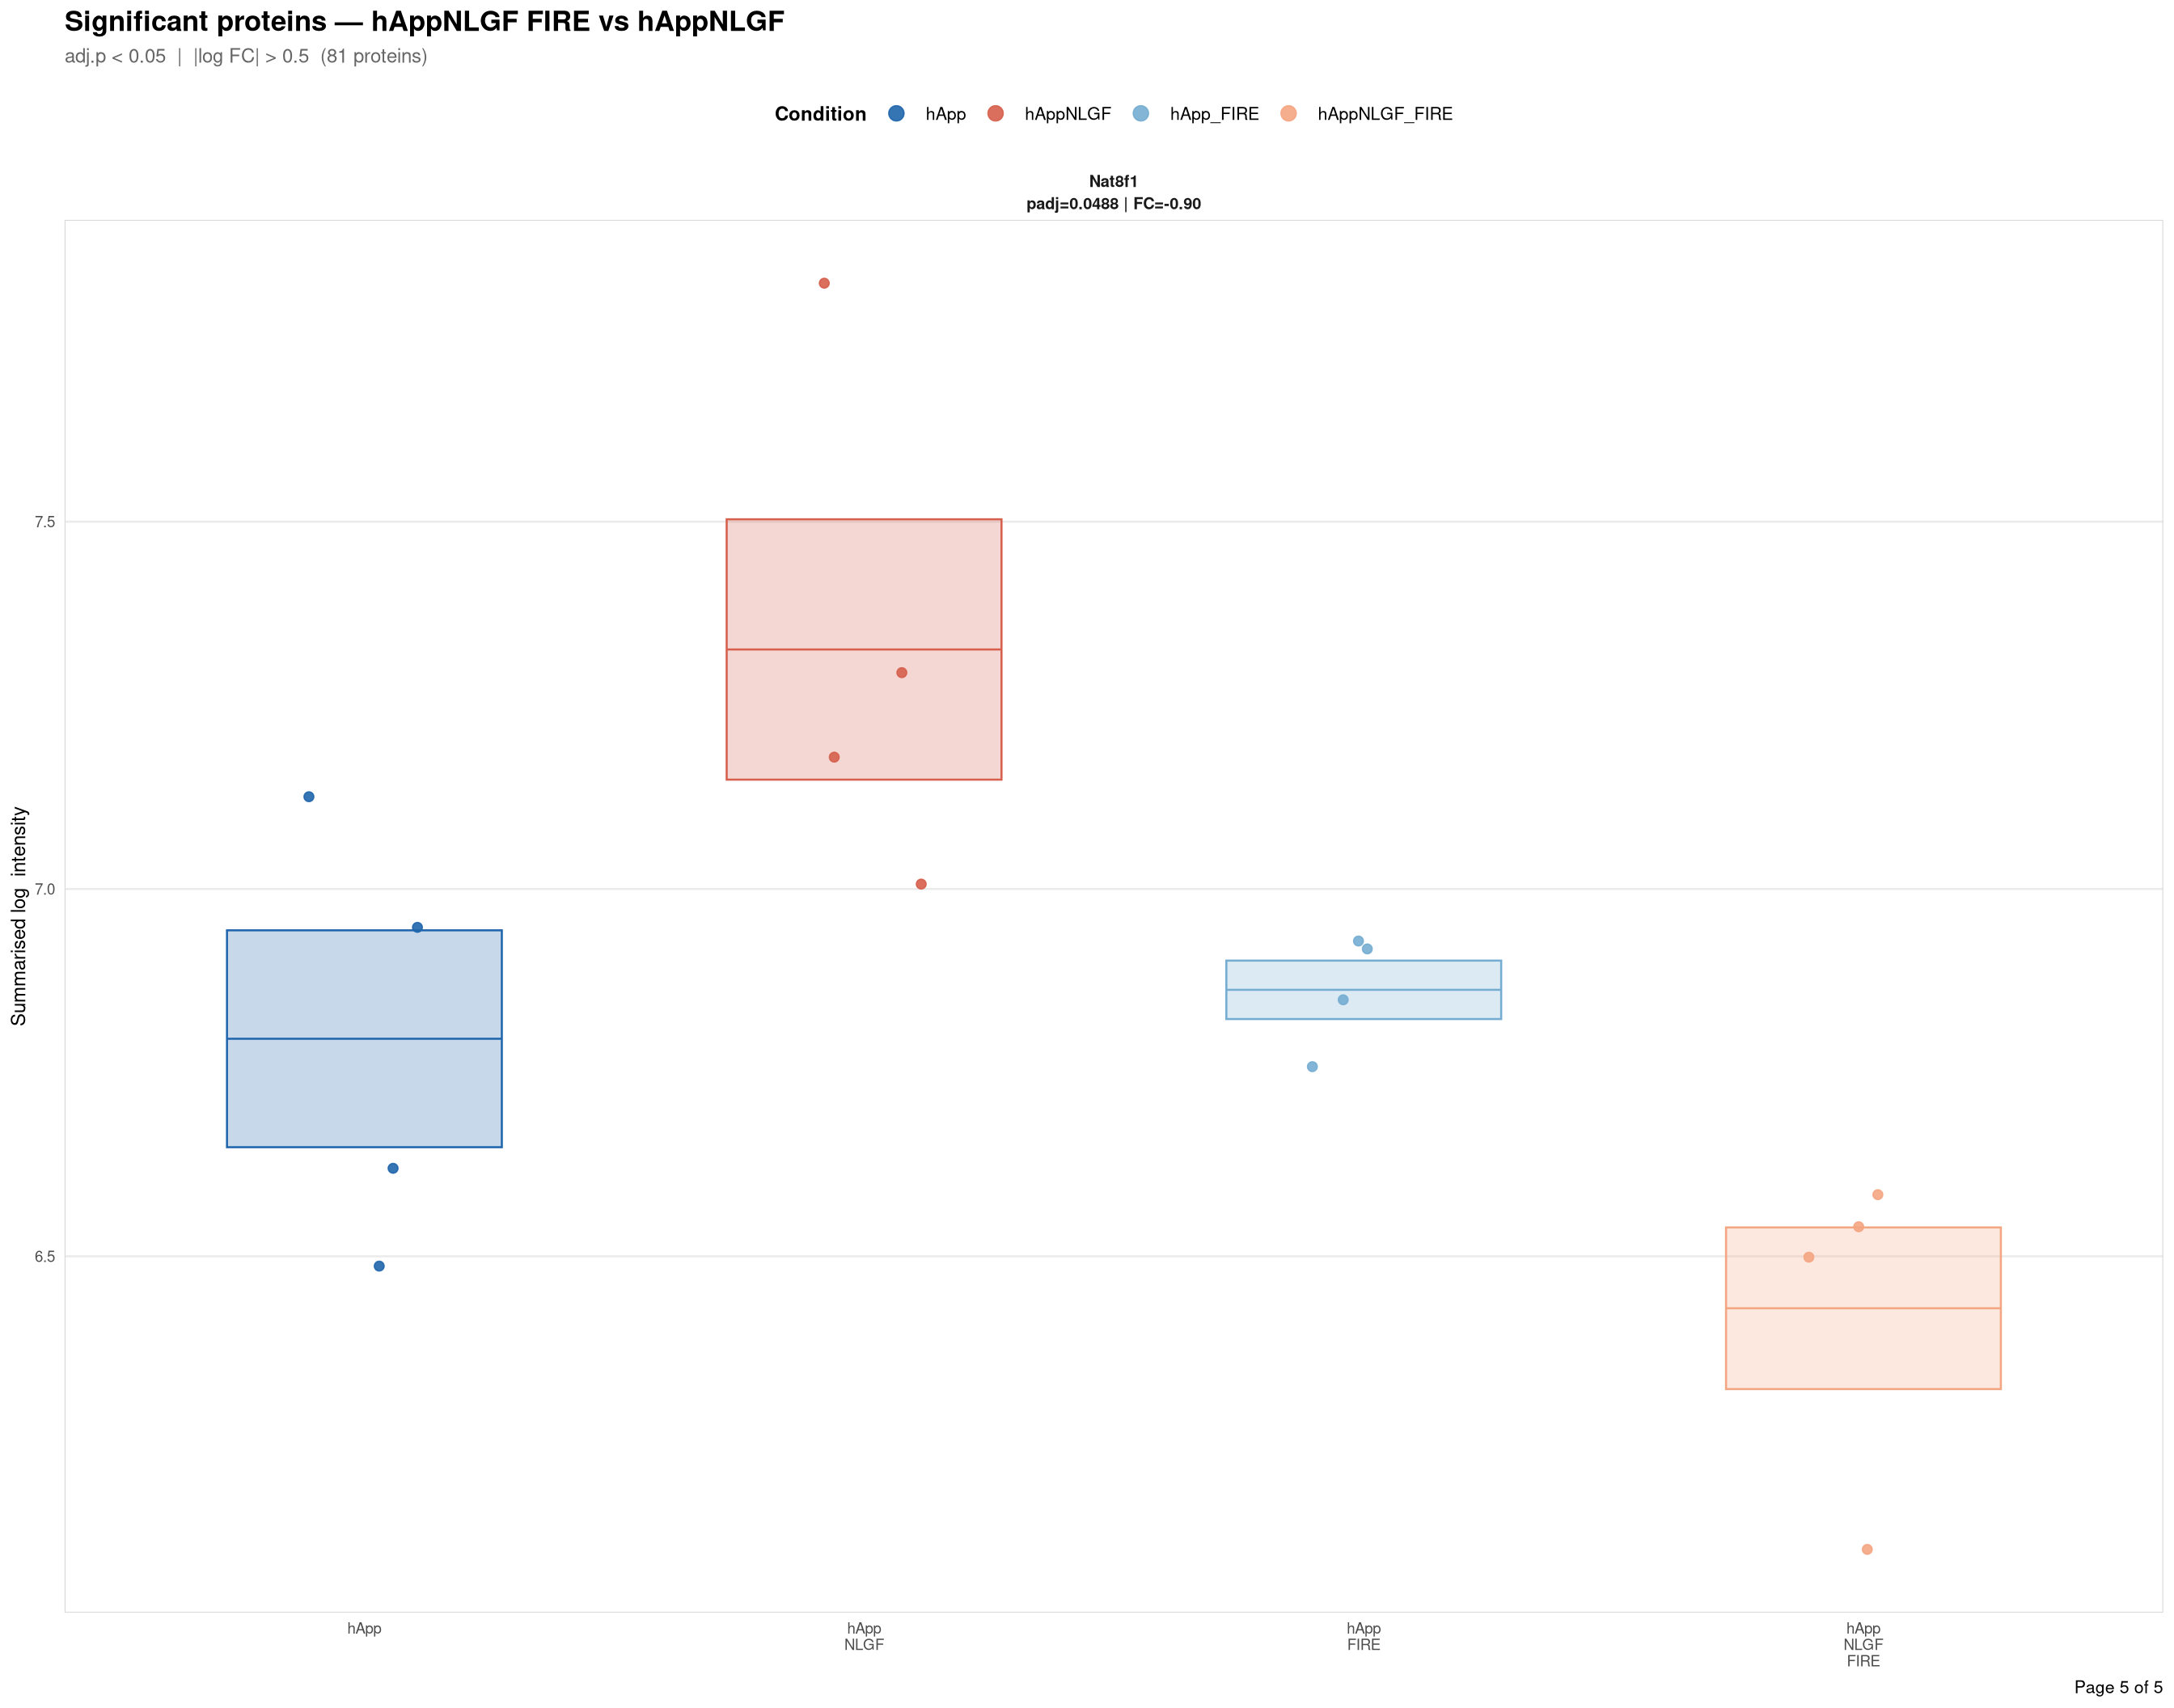
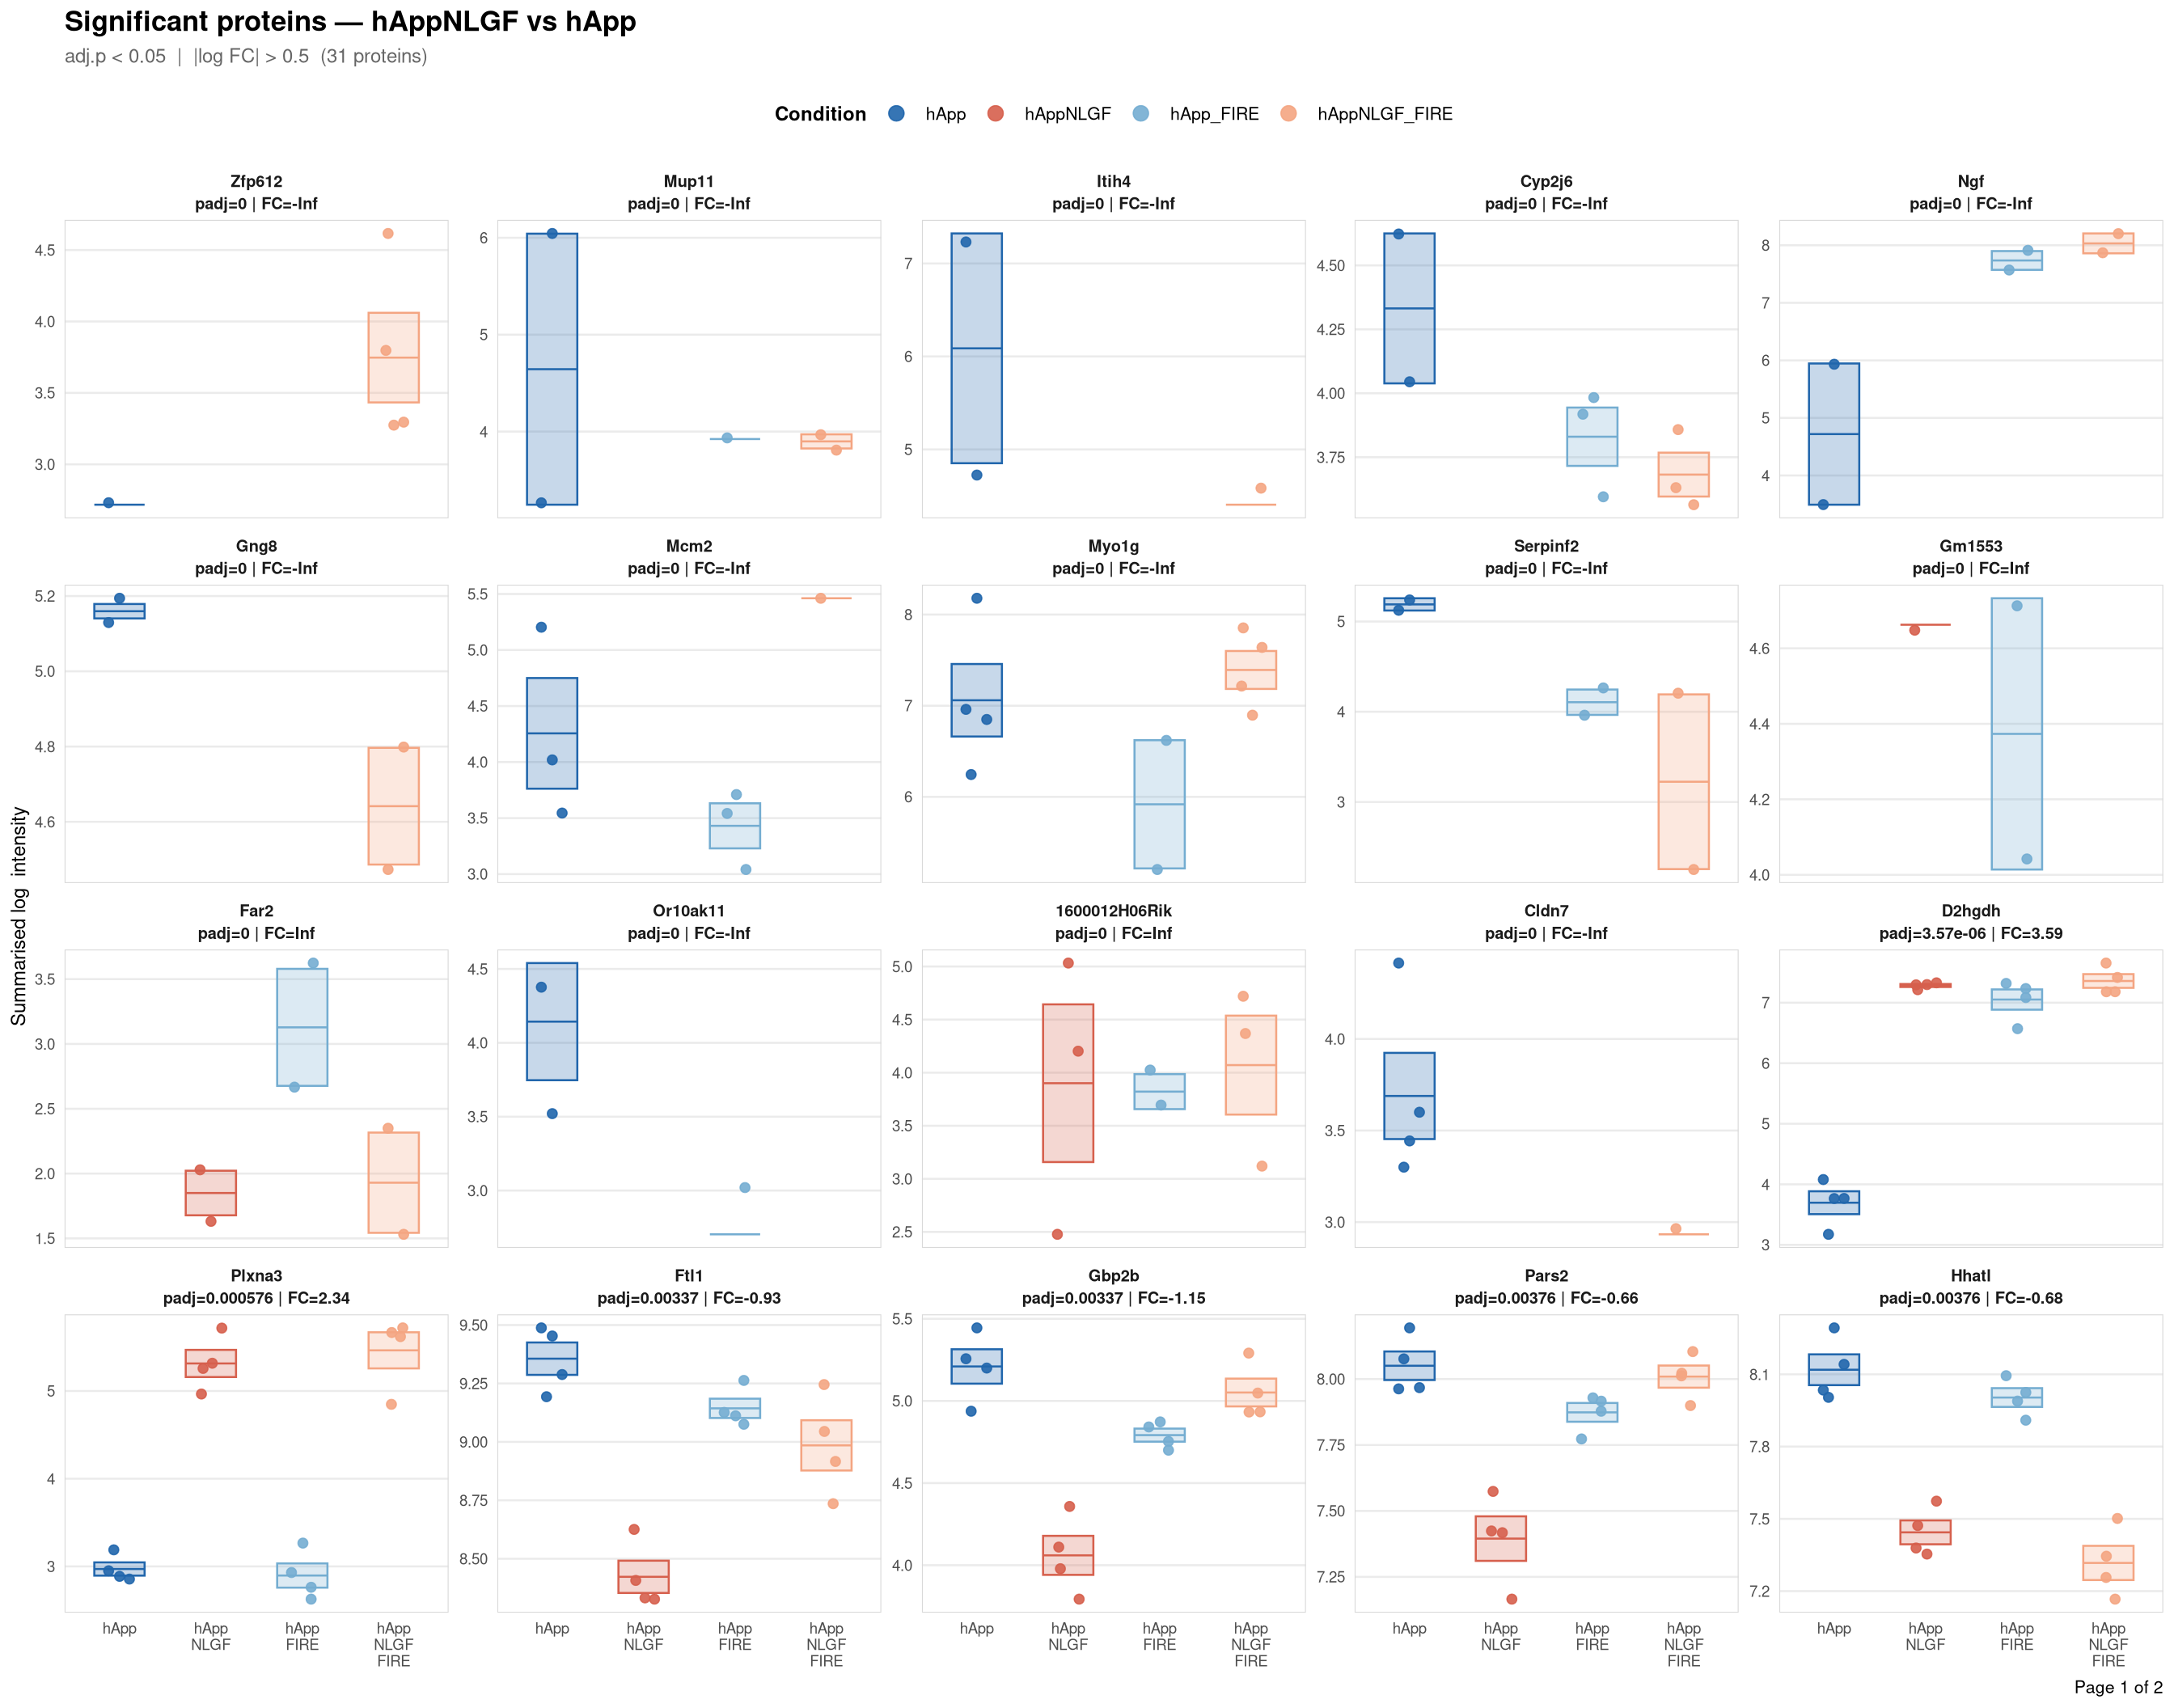
Saved: /nemo/lab/destrooperb/home/shared/zanettc/giulia_proteomics/bulk_proteomics/results/run4/ProteinProfiles_hAppNLGF_vs_hApp.pdf ( 2 page(s), 31 proteins)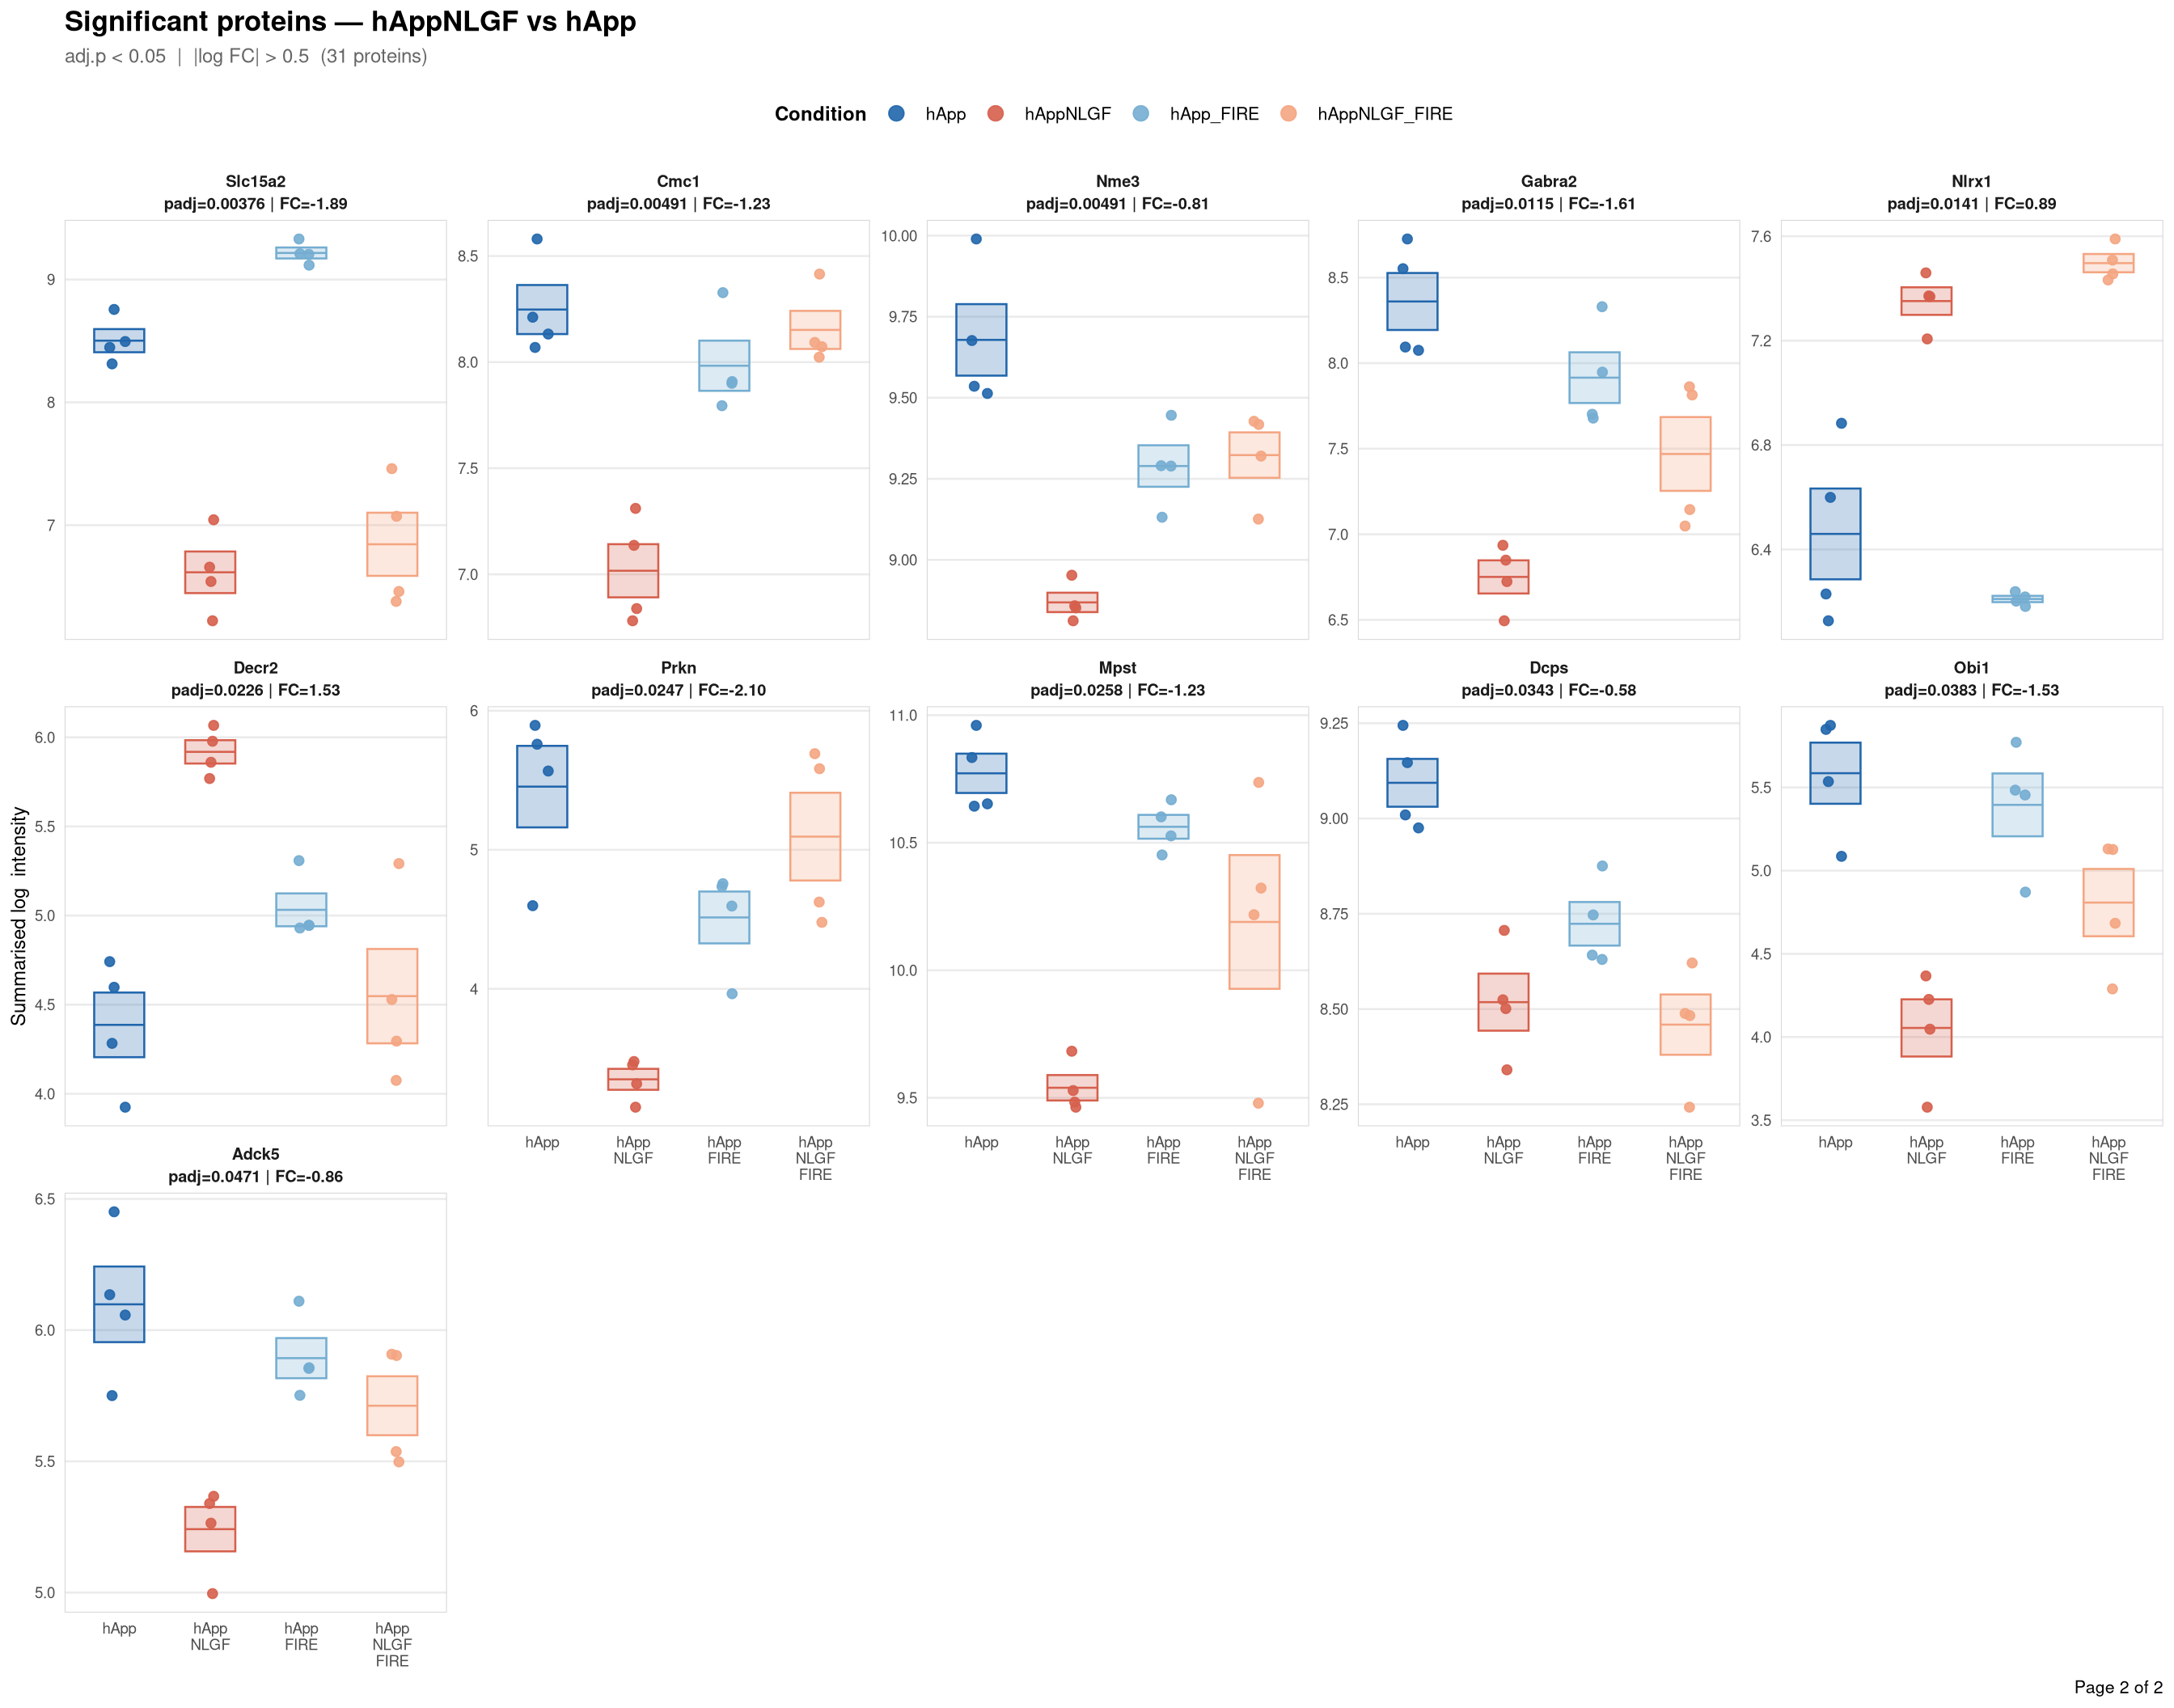
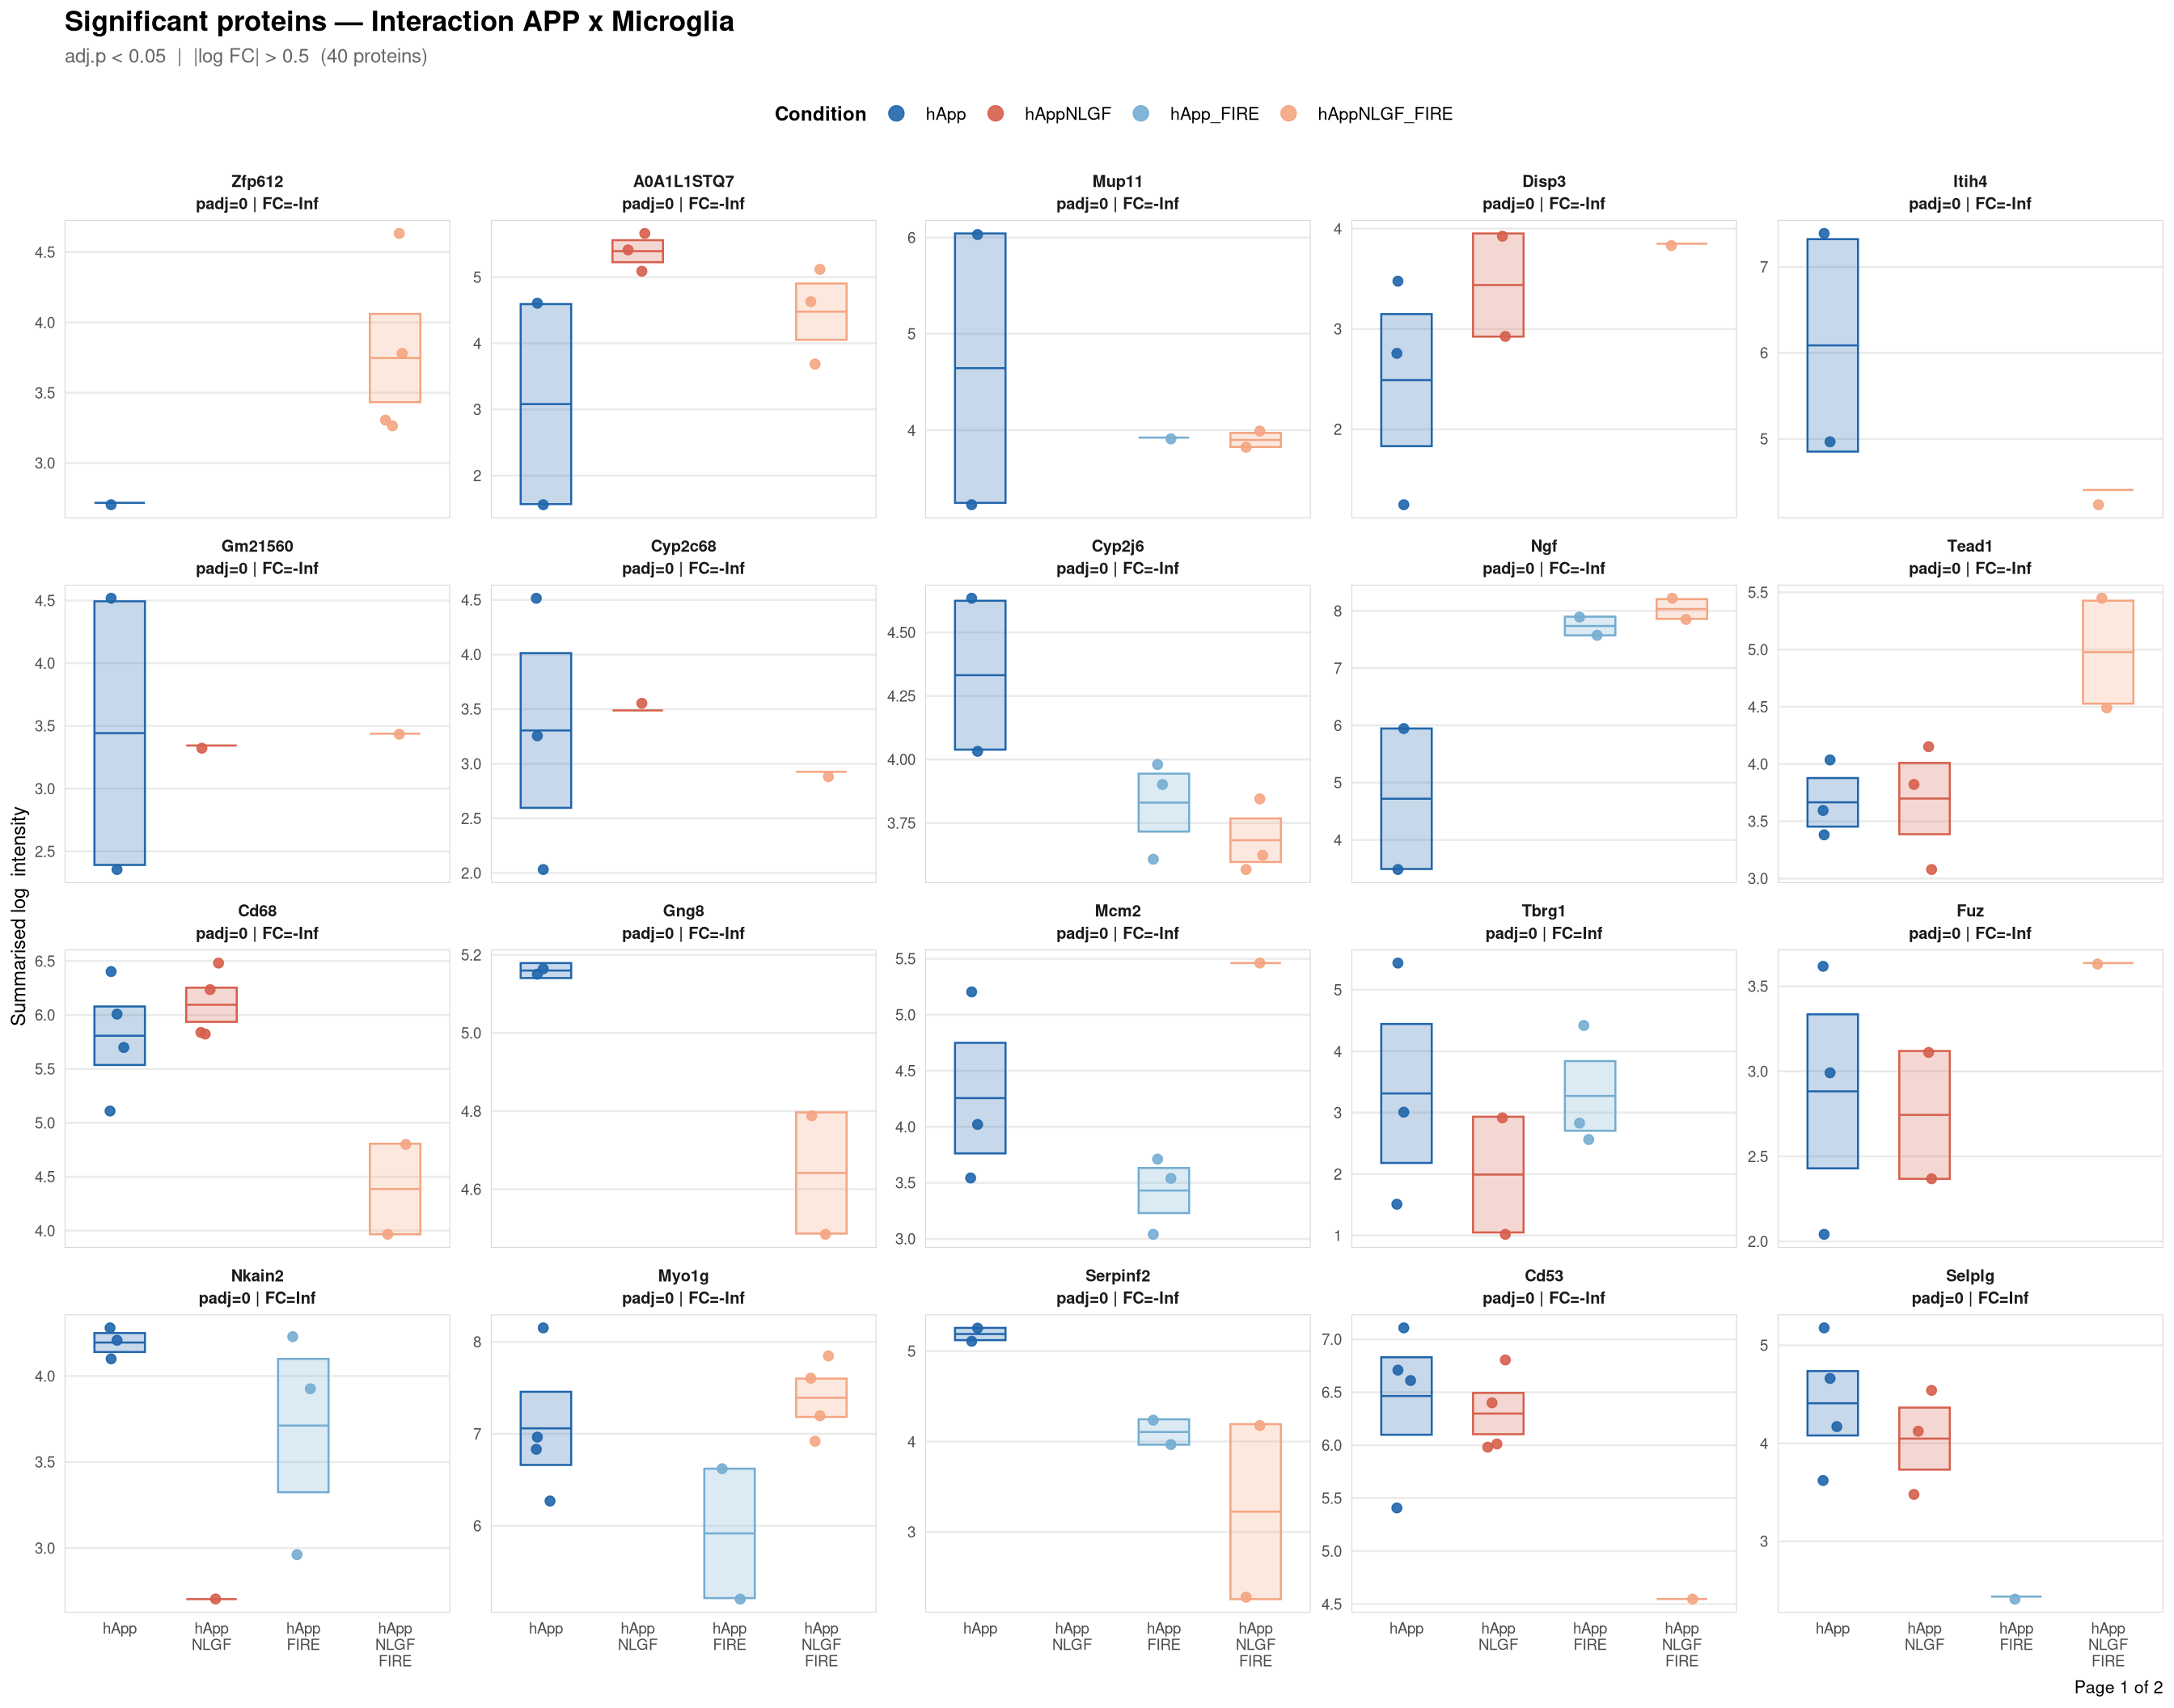
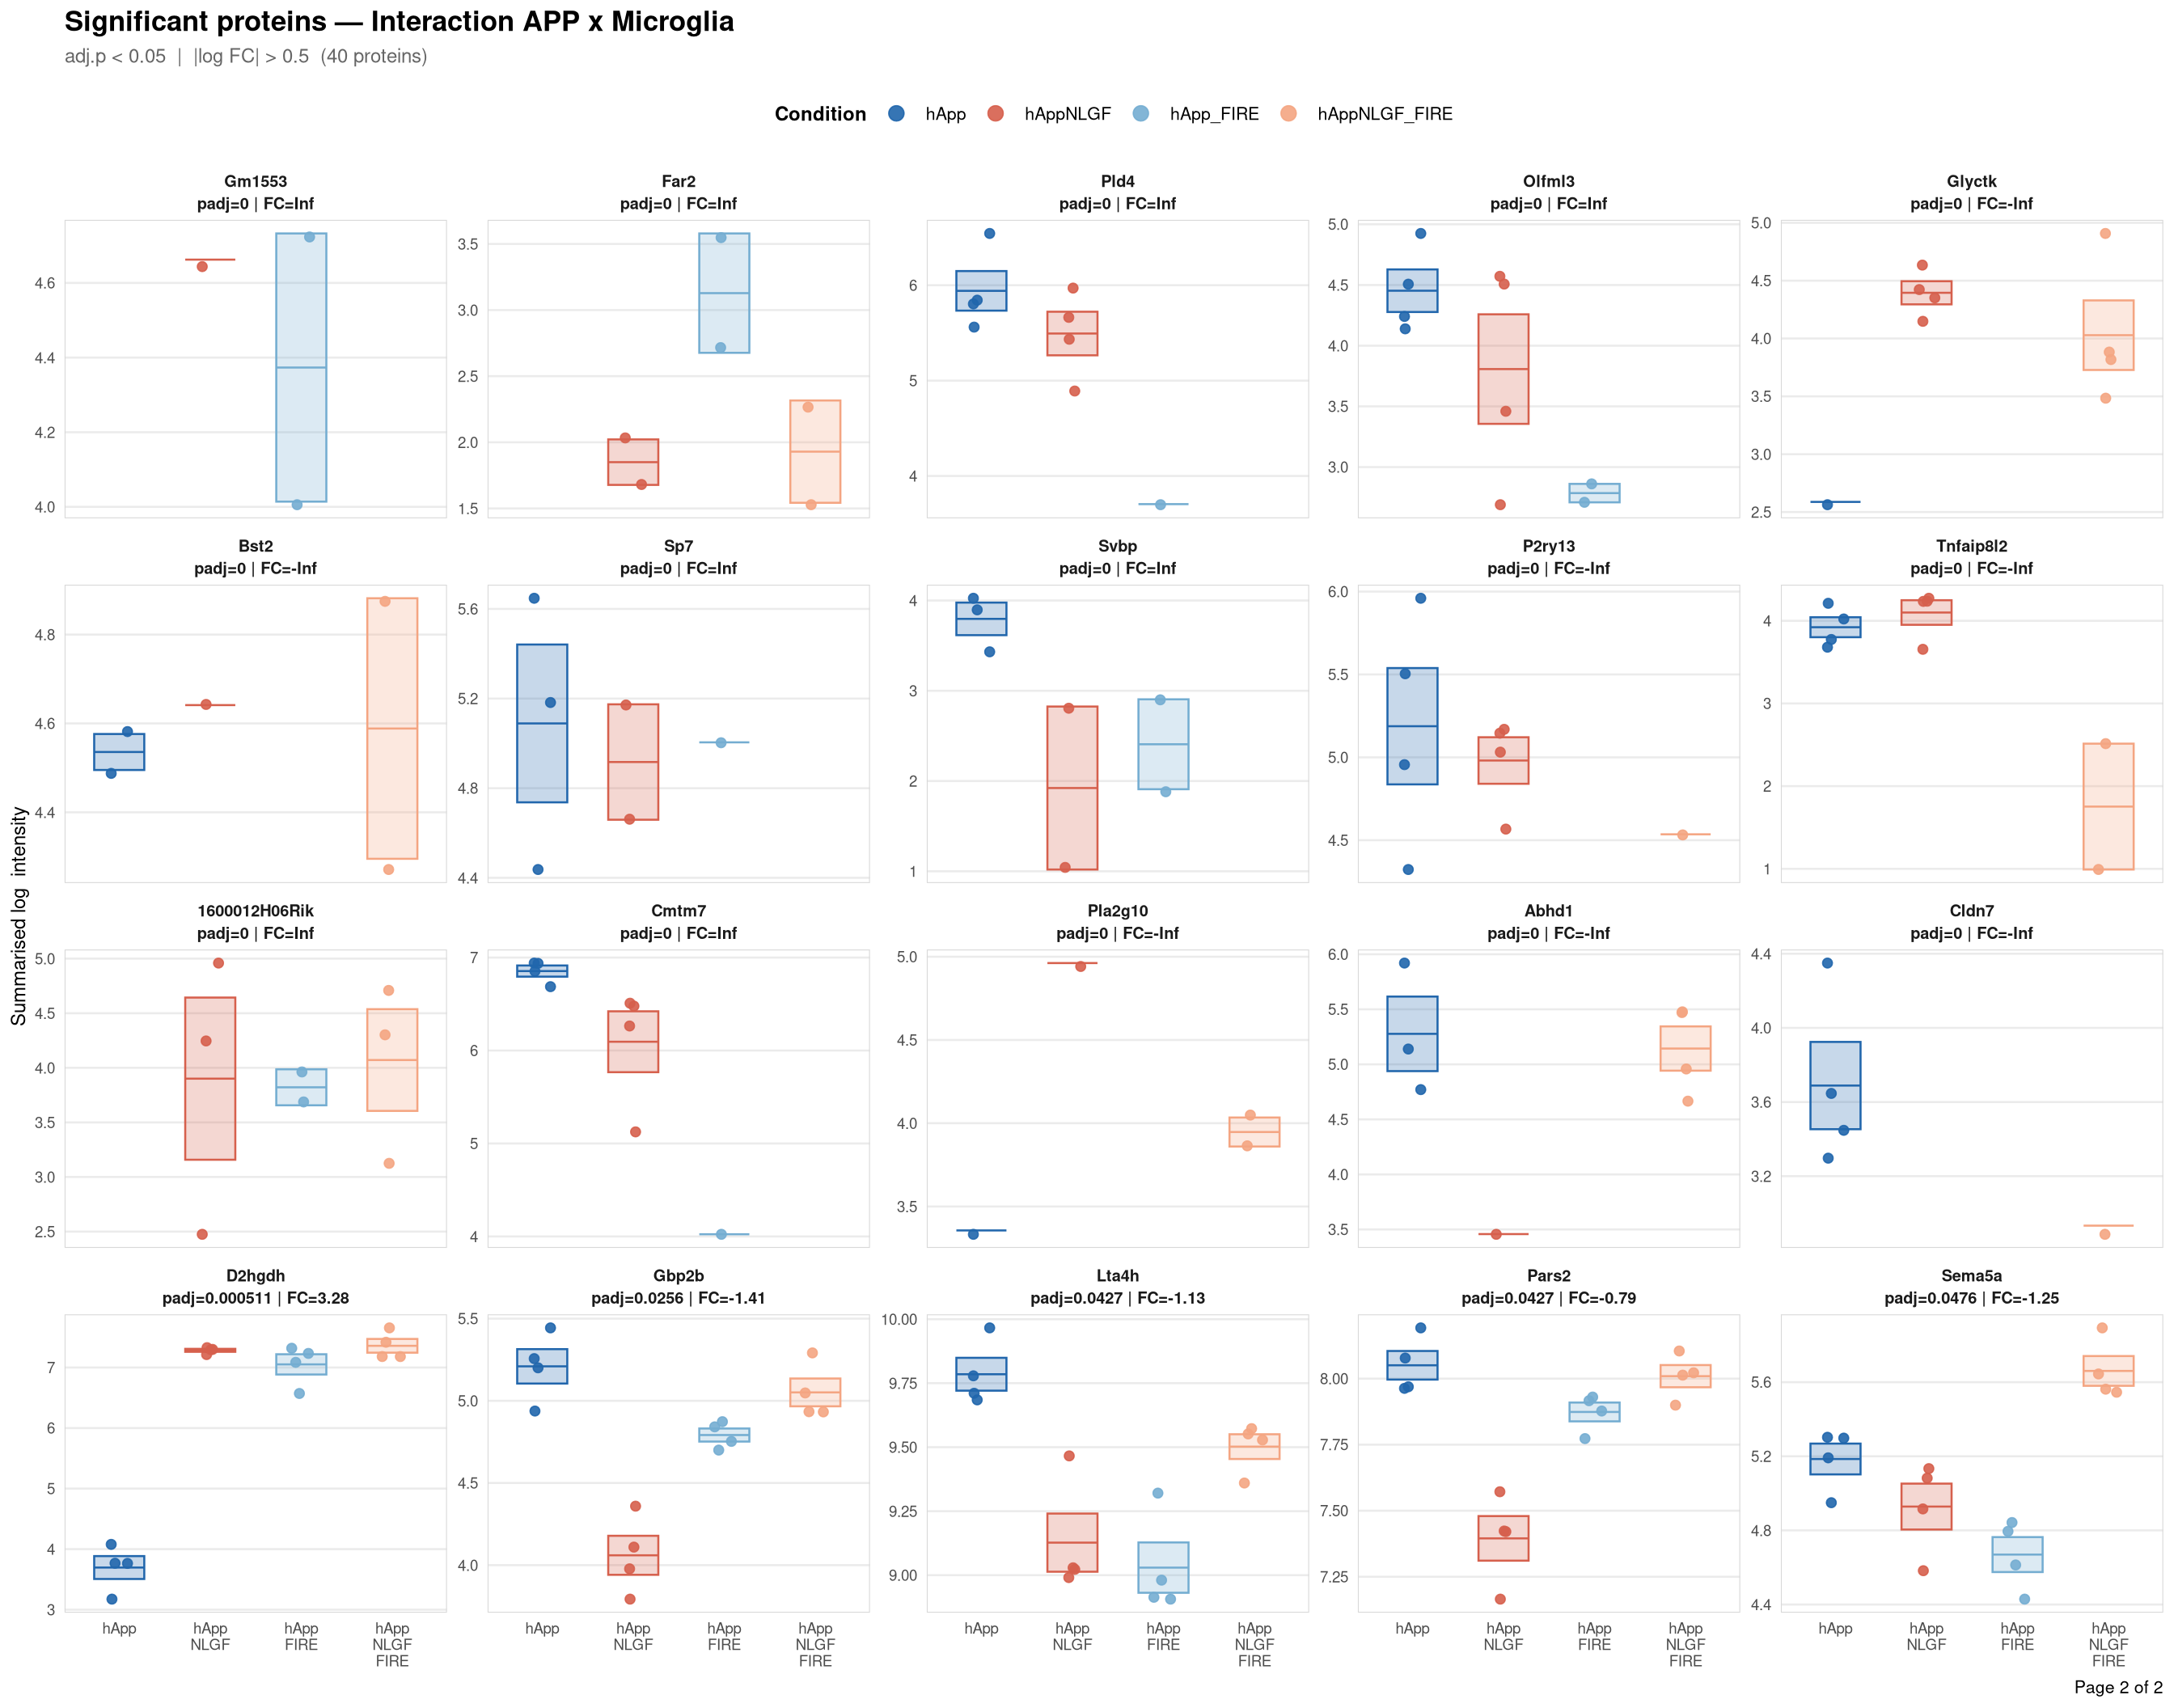
Saved: /nemo/lab/destrooperb/home/shared/zanettc/giulia_proteomics/bulk_proteomics/results/run4/ProteinProfiles_Interaction_APP_x_Microglia.pdf ( 2 page(s), 40 proteins)